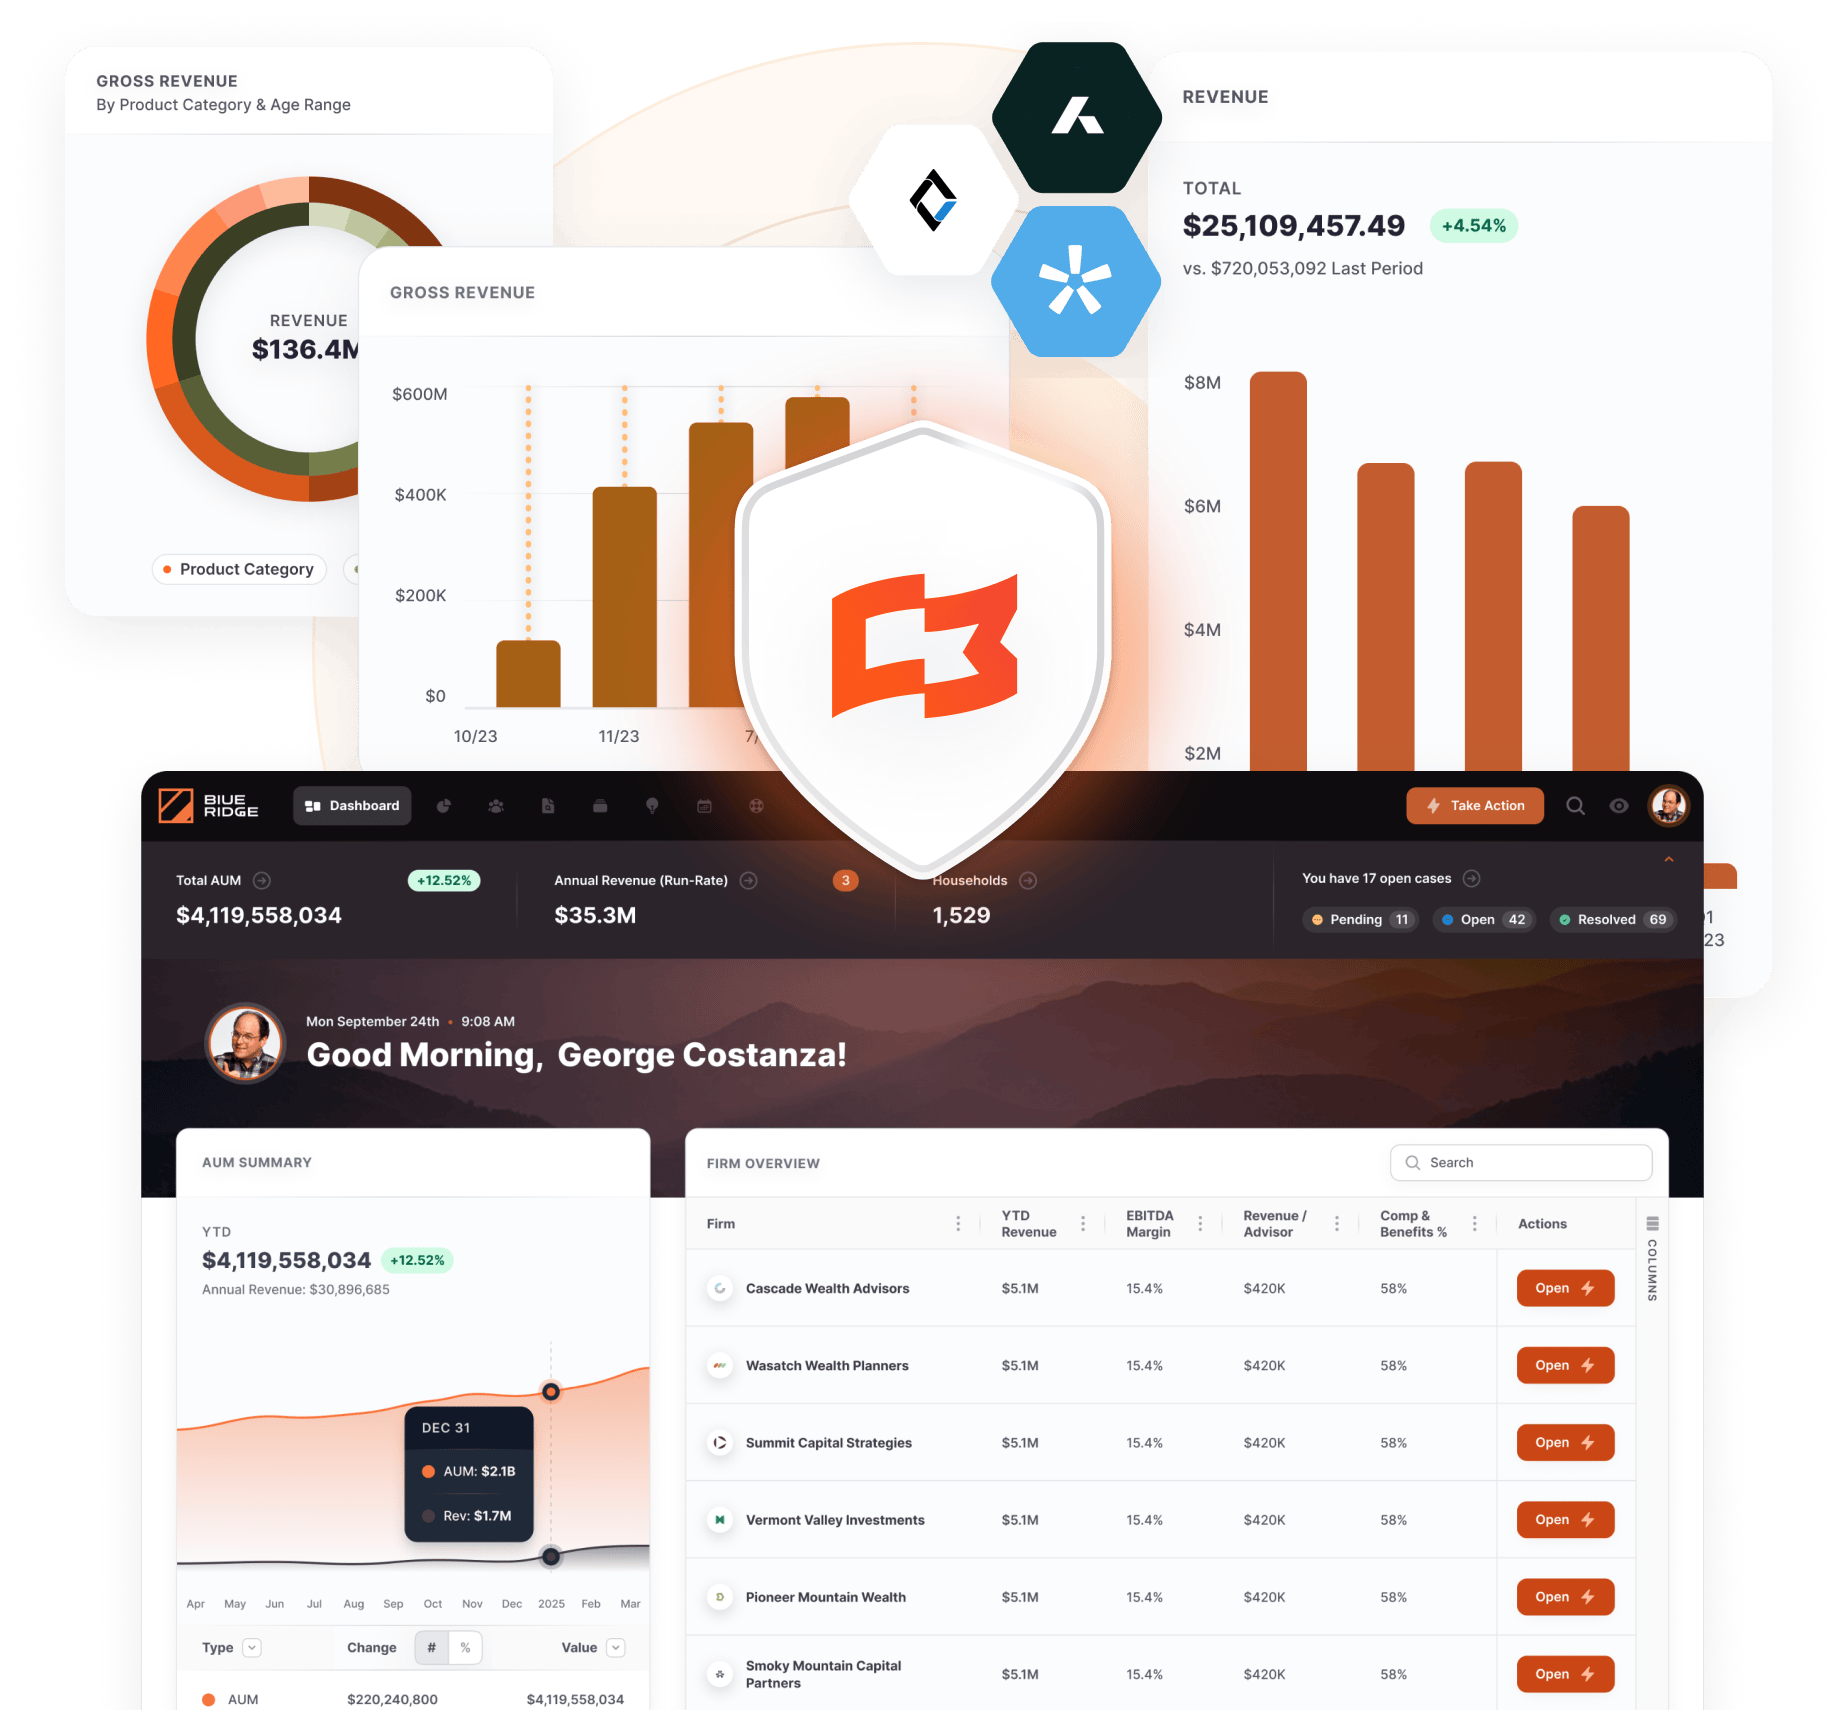
- Milemarker™ Platform
- Command Center
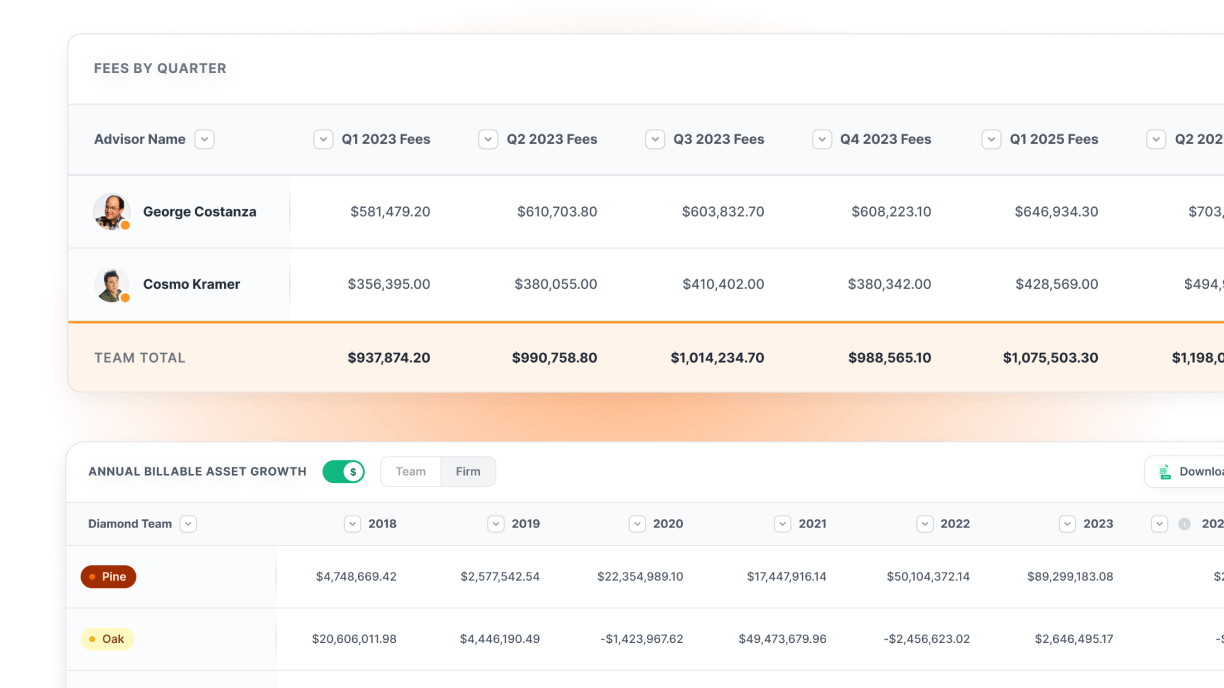
- Compensation Management
Stop Calculating Payouts.
Start Automating Trust.
Your advisor comp is a nightmare of spreadsheets, special deals, and “wait, what was their grid again?”
Turn payout chaos into automated precision. Your advisors get transparency. You get your life back.
- The Problem
Your Compensation Is Compensating for Nothing
Month-end is coming. Time to calculate advisor payouts.
Smith gets 90% on everything over $10K. Unless it’s insurance. Then it’s 75%. But not on renewals. Those are 85%. Unless he hit his quarterly bonus threshold. Then it’s different.
Johnson has a different grid.
Plus overrides on her team’s production. Plus a retention bonus that vests monthly. Plus that one-off deal you made last year.
Williams just joined.
New grid structure. Transition bonuses. Draw against future commissions. None of your formulas work.
By the time you figure it out, it’s next month.
- What's Really Broken
Every Exception Breaks Your System
Grid Chaos
Forty advisors, forty different compensation plans. Stored in your head, scattered across spreadsheets, buried in contract folders.
Manual Everything
Calculate each payout by hand. Double-check the math. Triple-check the exceptions. Still get it wrong.
Transparency Zero
Advisor calls asking why their check is different. You scramble to reconstruct your logic. Neither of you trust the answer.
Scale Impossible
Every new advisor means more complexity. More exceptions. More manual work. More mistakes.
Your growth is strangled by your compensation complexity.
- What We Fix
All Your Rules. One System. Zero Exceptions.

Rule Consolidation
Every grid, override, bonus, and exception lives in one system. Complex logic handled automatically. No more hunting for that special deal.

Exception Mastery
Transition bonuses, retention deals, team overrides, draw arrangements—all configured once, calculated forever.

Automated Precision
System calculates every payout exactly right, every time. No more manual math. No more “close enough.”

Complete Transparency
Advisors see exactly how their compensation is calculated. Real-time preview of their next payout. Questions answered before they’re asked.
Automate Advisor Payouts with Precision and Transparency
Universal Rule Engine
- Handle any compensation structure, no matter how complex
- Grid schedules, overrides, bonuses, draws — all automated
- Unlimited exception types & special arrangements
- Rules that adapt as your business grows
Real-Time Calculations
- Payouts calculate automatically as revenue flows in
- Advisors see live previews of their compensation
- No more month-end scrambling or calculation errors
- Instant impact analysis of compensation changes
Transparency Dashboard
- Advisors see exactly how their pay is calculated
- Detailed breakdowns of every component
- Historical payout tracking & trending
- Dispute resolution with complete audit trails

Exception Management
- Transition bonuses for new advisors
- Retention deals & vesting schedules
- Team-based overrides & splits
- One-off arrangements & special terms
Multi-Advisor Support
- Handle hundreds of unique compensation plans
- Team-based splits & hierarchical overrides
- Geographic & product-based variations
- Acquisition integration for new advisor terms
The Transformation
- Before Compensation Management
- Month-end payouts = 40 hours of spreadsheet hell
- Advisor questions = “let me check my calculations”
- New advisor onboarding = recreate compensation logic
- Compensation disputes = he-said-she-said arguments
- After Compensation Management

Month-end payouts

click calculate, review, approve

Advisor questions
“check your dashboard”

New advisor onboarding
configure rules once, calculate forever

Compensation disputes
complete transparency eliminates arguments
Real Results
Every conference I’ve gone to for the last 15 years same complaint the quality of the data where it’s located how it’s siled but Milemarker™ is working on something to help fix that for lots of RIAs.

Jason Pereira
Senior Partner at Woodgate Financial, Inc

90%
reduction in payout calculation time
95%
fewer advisor payout inquiries

Zero
compensation calculation errors

Complete
audit trail for every payment
Built For
Complex Firms

Acquisition Integration
Seamlessly integrate acquired advisors with their existing compensation terms. No disruption to their pay structure.

Multi-Entity Support
Handle different compensation structures across offices, regions, or business lines. Unified reporting with distributed rules.
Regulatory Compliance
Built-in compliance checks for compensation regulations. Automatic documentation for regulatory review.


Scalable Architecture
Add advisors, create new compensation plans, implement complex arrangements—all without breaking existing calculations.
Advanced
Features

Dynamic Grid Management
- Time-based grid changes & promotions
- Performance-based tier adjustments
- Automatic recalculation when grids change
- Historical grid tracking for audit purposes

Team-Based Compensation
- Hierarchical overrides & management bonuses
- Team production aggregation & splits
- Cross-team collaboration incentives
- Leadership compensation tied to team performance

Draw & Advance Management
- Draw against future commissions
- Advance repayment tracking & automation
- New advisor transition support
- Recovery scheduling & management
Integration
& Data Flow

CRM Integration
Pull advisor hierarchy, client assignments, and relationship data directly from your CRM system.
Revenue Systems
Connect to custodians, billing platforms, and trading systems for real-time revenue tracking.

Payroll Integration
Export calculated compensation directly to your payroll system. No manual entry required.
Accounting Sync
Automated journal entries and expense allocation for accurate financial reporting.
Ready to Automate Your Compensation?
Free analysis of your compensation complexity and automation opportunities.
Watch complex advisor payouts calculate automatically.
30 minutes to map better workflows for your firm.

Stop being the compensation bottleneck.
Stop explaining why the math is different every month.

Stop losing advisors to compensation confusion.
Why This Matters
Compensation disputes kill advisor relationships. Manual calculations kill your time. Complex exceptions kill your growth.