Your Board Asks.
Answer Board Questions Instantly with Milemarker™ Executive Console
No more “let me get back to you” when the board wants to know your cost per advisor in Chicago vs. Atlanta. Get any insight, instantly.
The Board Meeting
Tuesday. 2pm. Here We Go.
Board member:
“What’s our cost per advisor across offices?”
You:
“Denver’s at $140K fully loaded, Phoenix is $128K.”
Board member:
“How does that impact our margins?”
You:
“Denver advisors average $680K revenue, so 79% margins. Phoenix runs $590K revenue, 78% margins.”
Board member:
“What about our EBITDA per advisor?”
You:
“Denver: $540K. Phoenix: $462K.”
Board member:
“Those are solid numbers. How do you track all this in real-time?”
You:
“Milemarker™.”
- Before Milemarker™
The Old Way
Board:
“What’s our cost per advisor?”
You:
“Let me get back to you.”
Spend 3 hours reconciling payroll, overhead, and headcount across offices.
- After Milemarker™
The New Way

Board:
“What’s our cost per advisor?”
You:
“Denver’s $140K, Phoenix is $128K.”

Board:
“What about EBITDA?”
You:
“Denver generates $540K per advisor, Phoenix $462K.”
Board:
“How current is this data?”
You:
“Updates automatically. These numbers are from this morning.”
You look like a genius.
- Why This Works
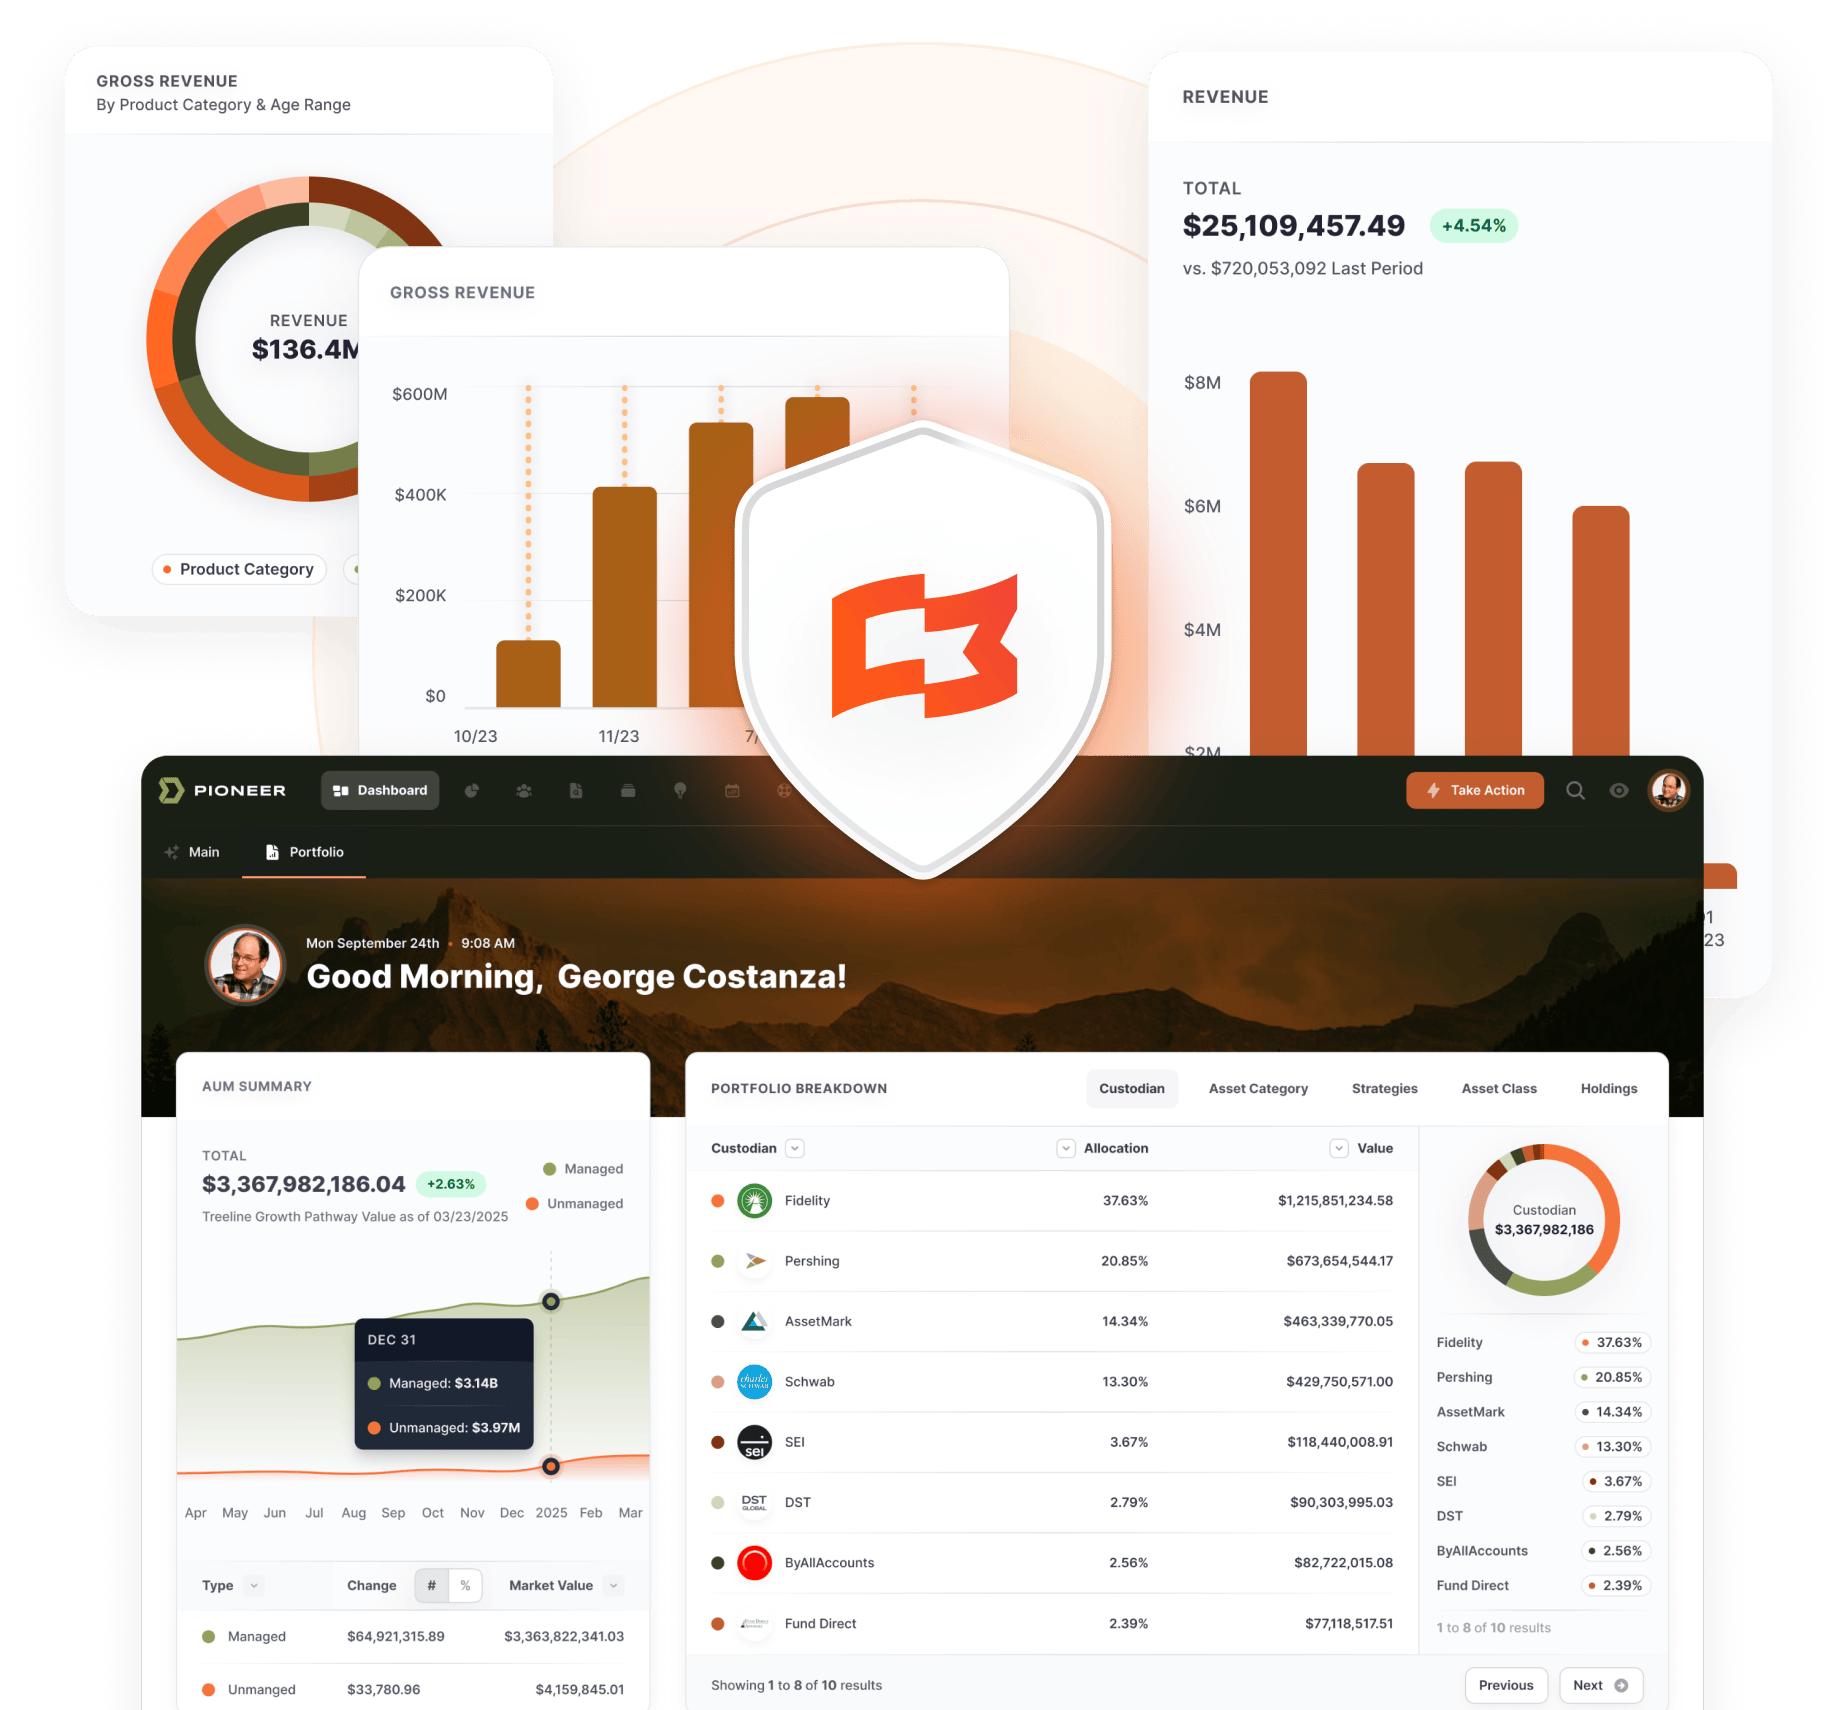
You Have All The Data


Every System Connected
CRM + Portfolio + Payroll + Accounting = One database

Any Question Answered
Cost per advisor? Yes.
Revenue per employee? Yes.
Profit per square foot? Yes.
Whatever they ask?Yes.

No Waiting
Your data updates automatically. Your answers are always current.
Real Results
As firms grow, operations naturally get messy with disconnected systems. Milemarker’s™ seasoned team cuts through that chaos and simplifies the complex with nimble technology. They empower firms to focus on growth and client service instead of manual processes to cover technology gaps.

Lacey Shrum
Founder Smart Kx
What You Get
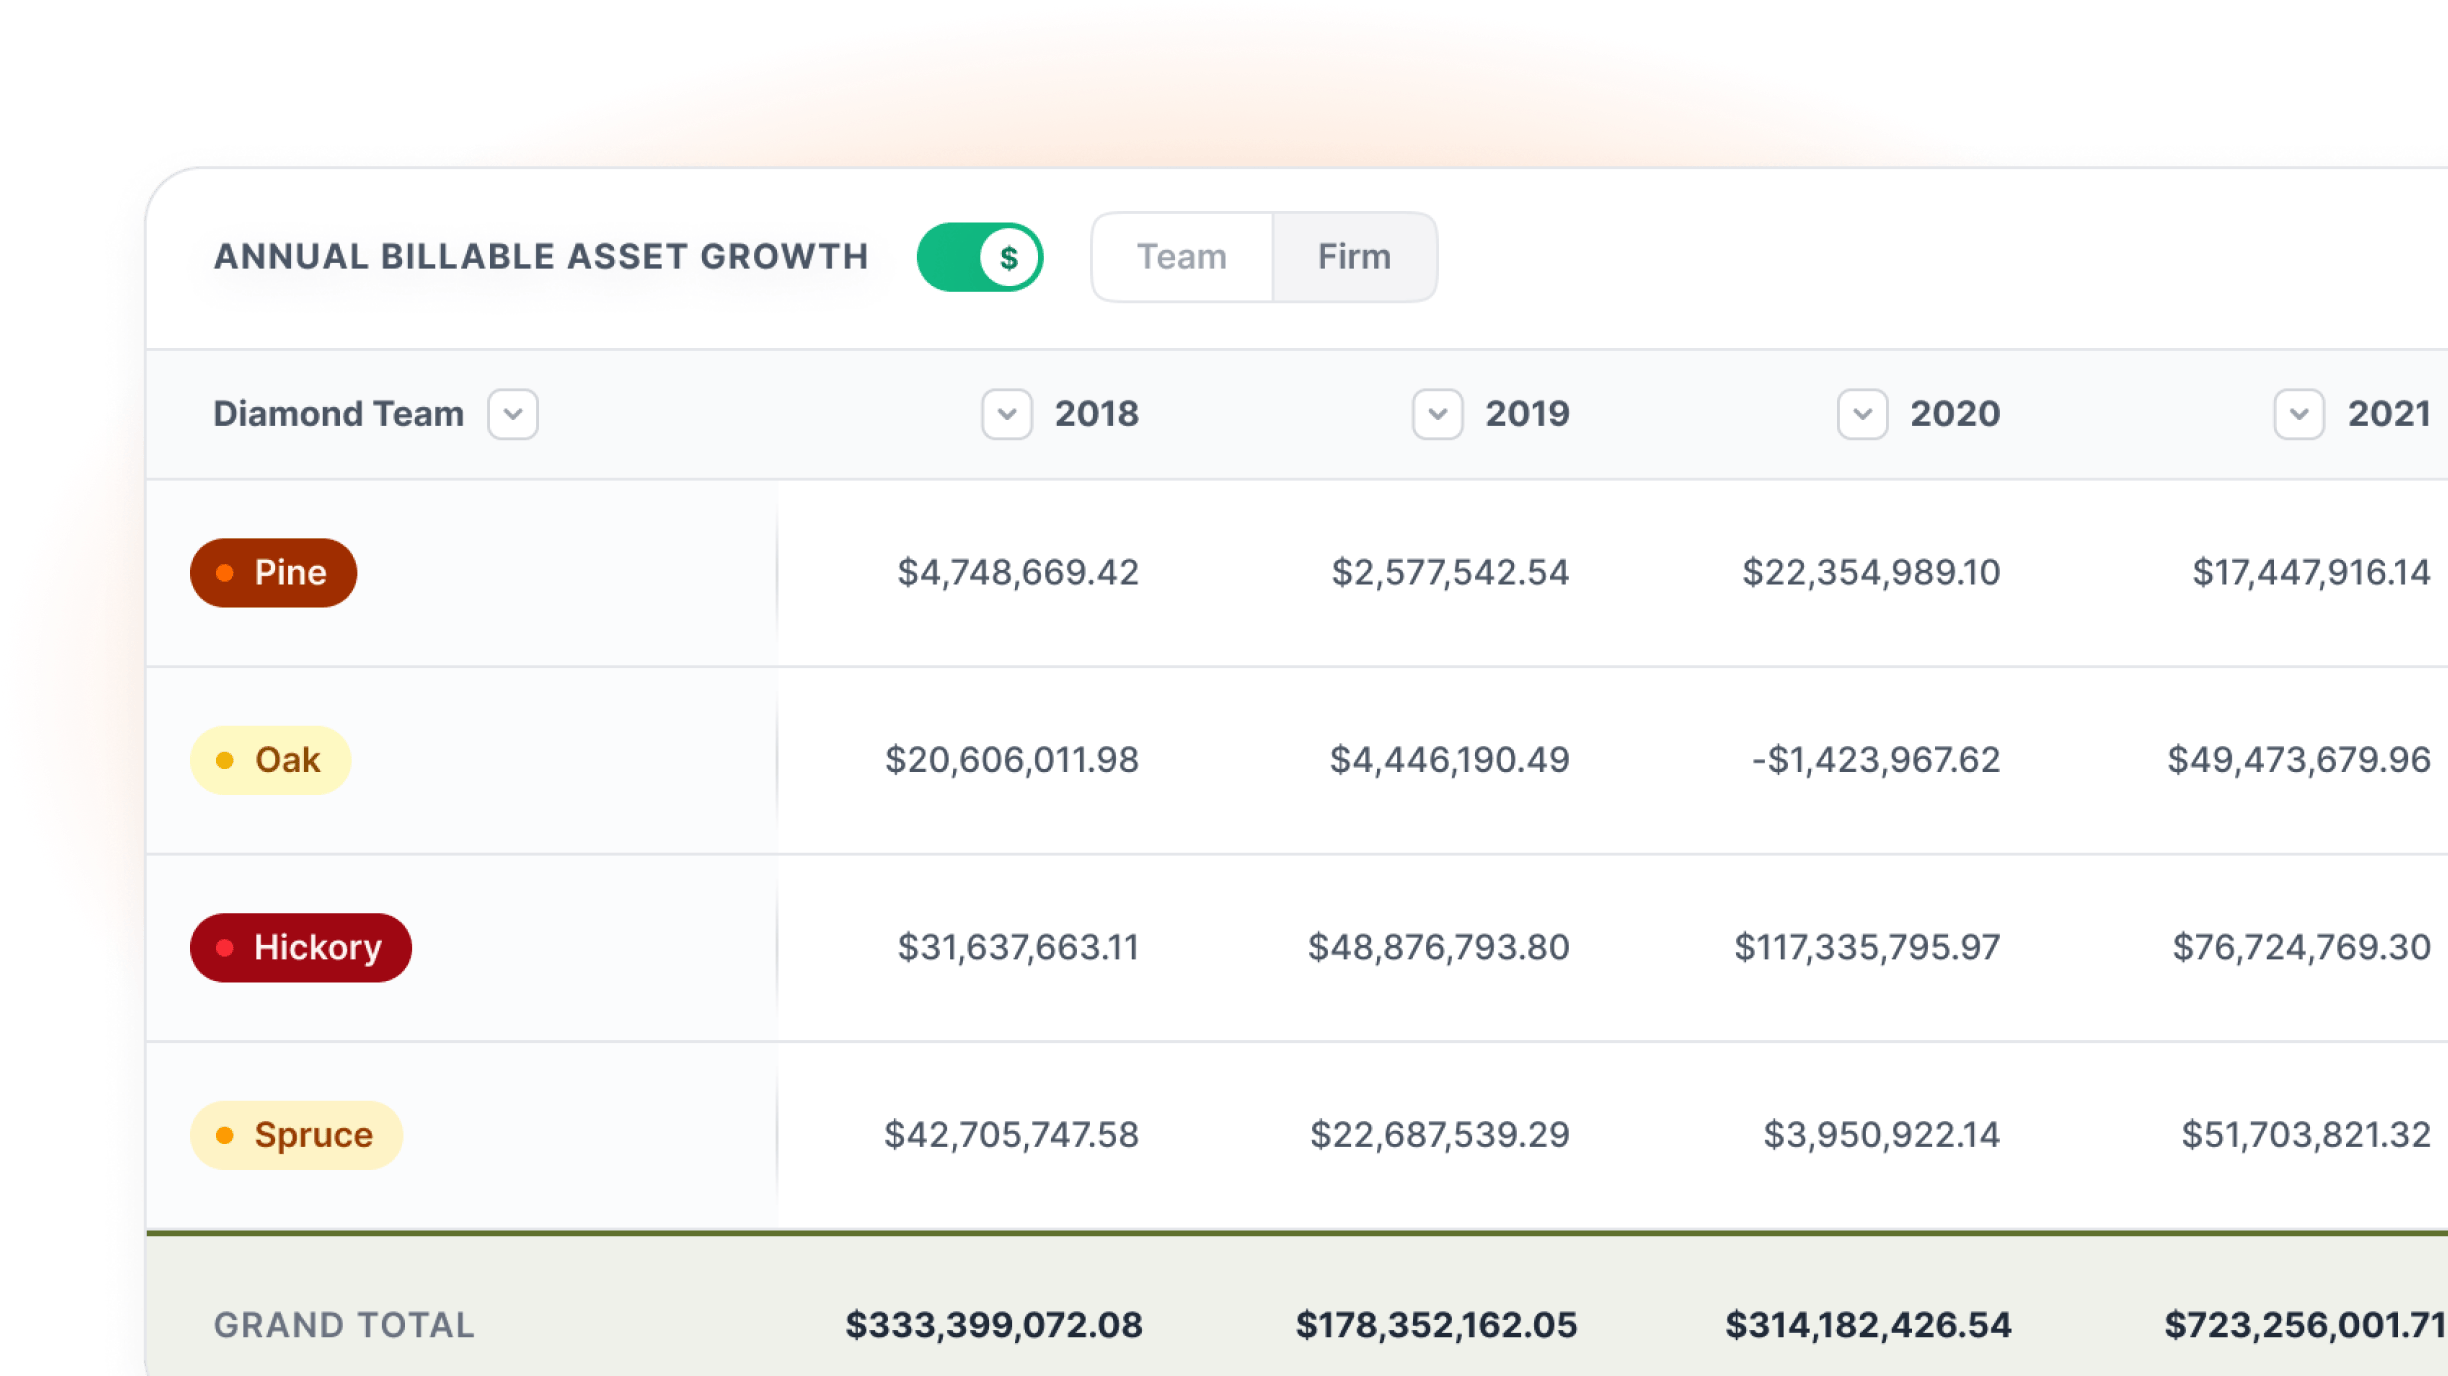
Cost Analysis
Team Metrics
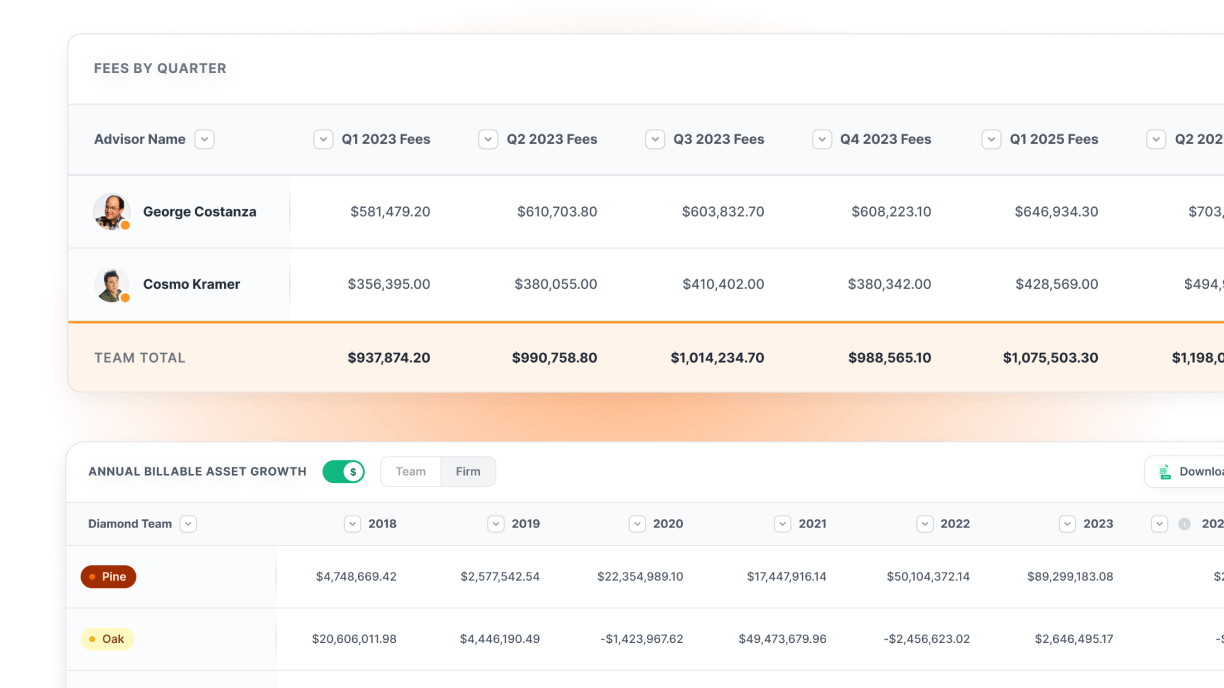
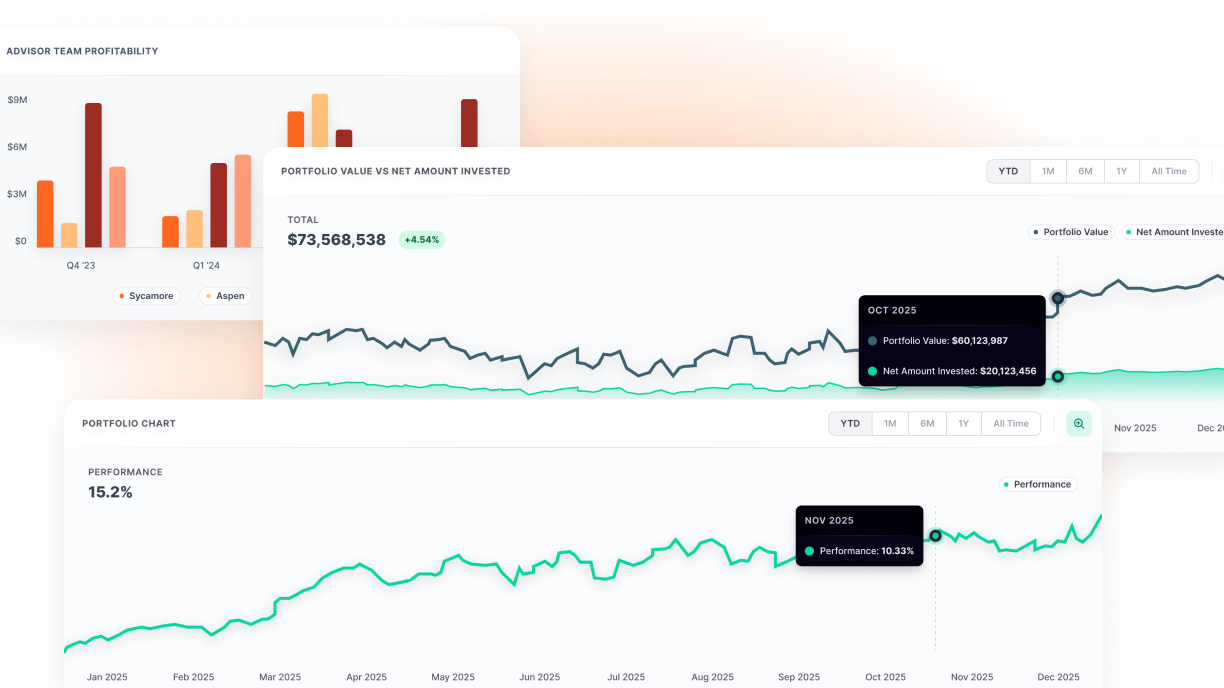
Performance Insights
Custom Everything
Part Of:
Ready to Look Like a Genius?
See how executives answer any board question instantly.
Stop saying “let me get back to you.”
Now you have answers.
