Turn Financial Chaos

Into Crystal Clear Insight

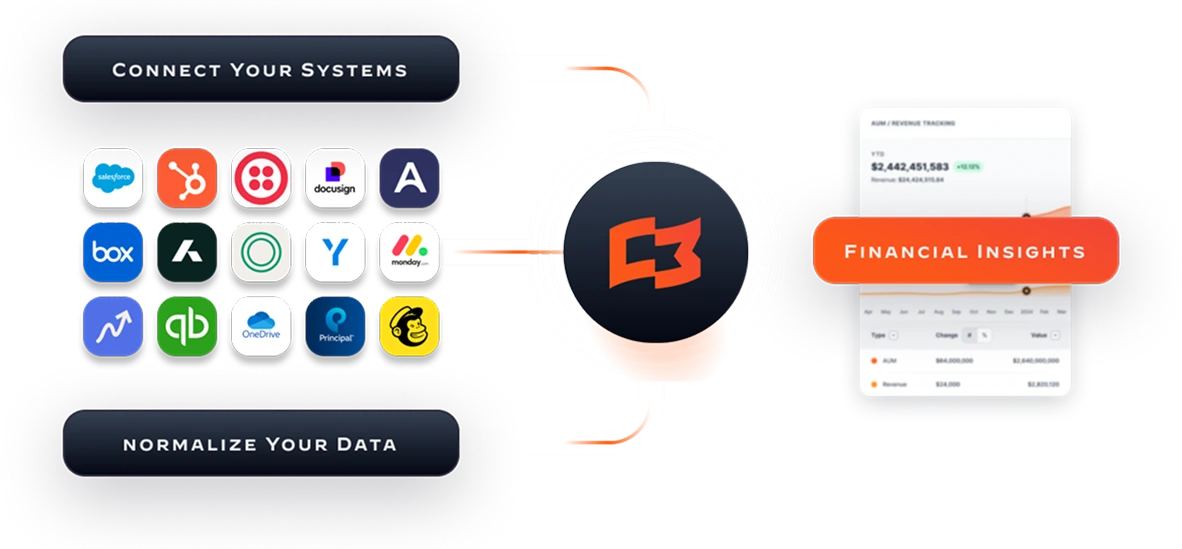
Tired of spending weeks reconciling advisor payouts? Sick of building revenue reports from scratch every month? Ready to actually use your data instead of just managing it?

Milemarker™ automates the complex stuff so you can focus on strategy.

Dashboard interface displaying revenue metrics and portfolio breakdown for financial management, featuring graphs, revenue totals, and user greeting, representing Milemarker™ solutions for simplified revenue reporting.

Your Month-End Close Shouldn't Take a Month

Every month, the same nightmare:

Advisor payouts scattered across 6 systems.

Revenue data that doesn’t match.

Fee calculations you can’t explain.

Executives asking for numbers you don’t trust.

By the time you finish reconciling, the data's already old.
You're not a data entry specialist. You're a CFO.

Automate Financial Chaos to Optimize Your Business

Optimize the Business.

Banknotes symbolizing alternative investments and unified financial management in the Milemarker™ platform.

Payout Automation

Complex advisor compensation calculated automatically. Grid schedules, overrides, bonuses—all reconciled in real time.
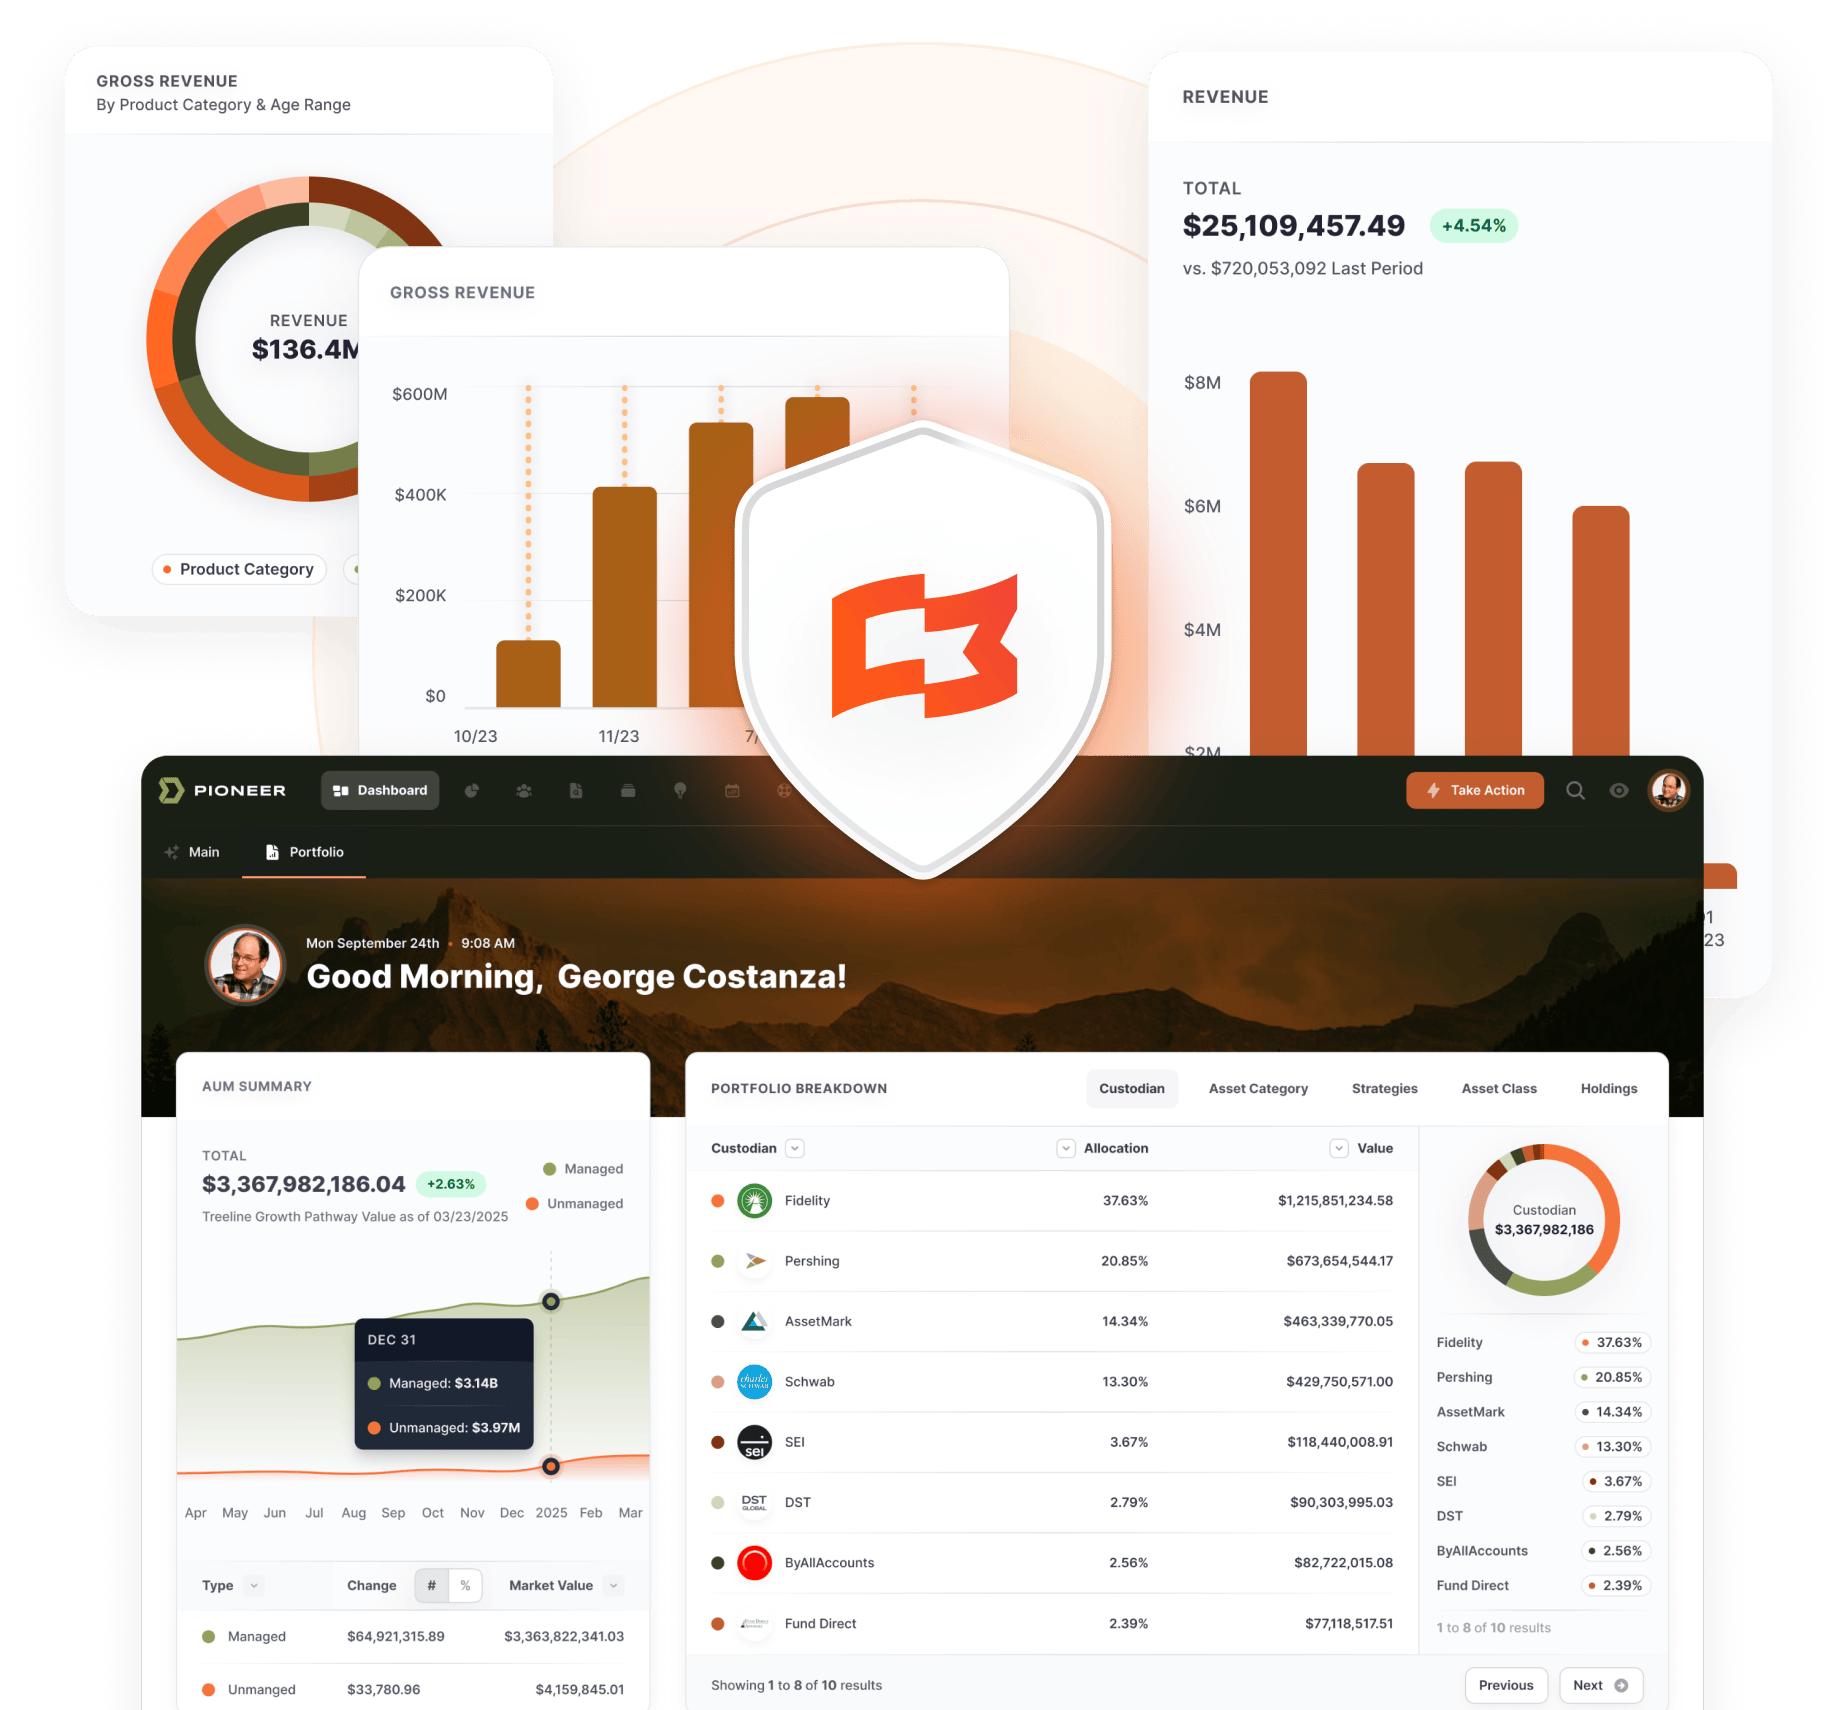
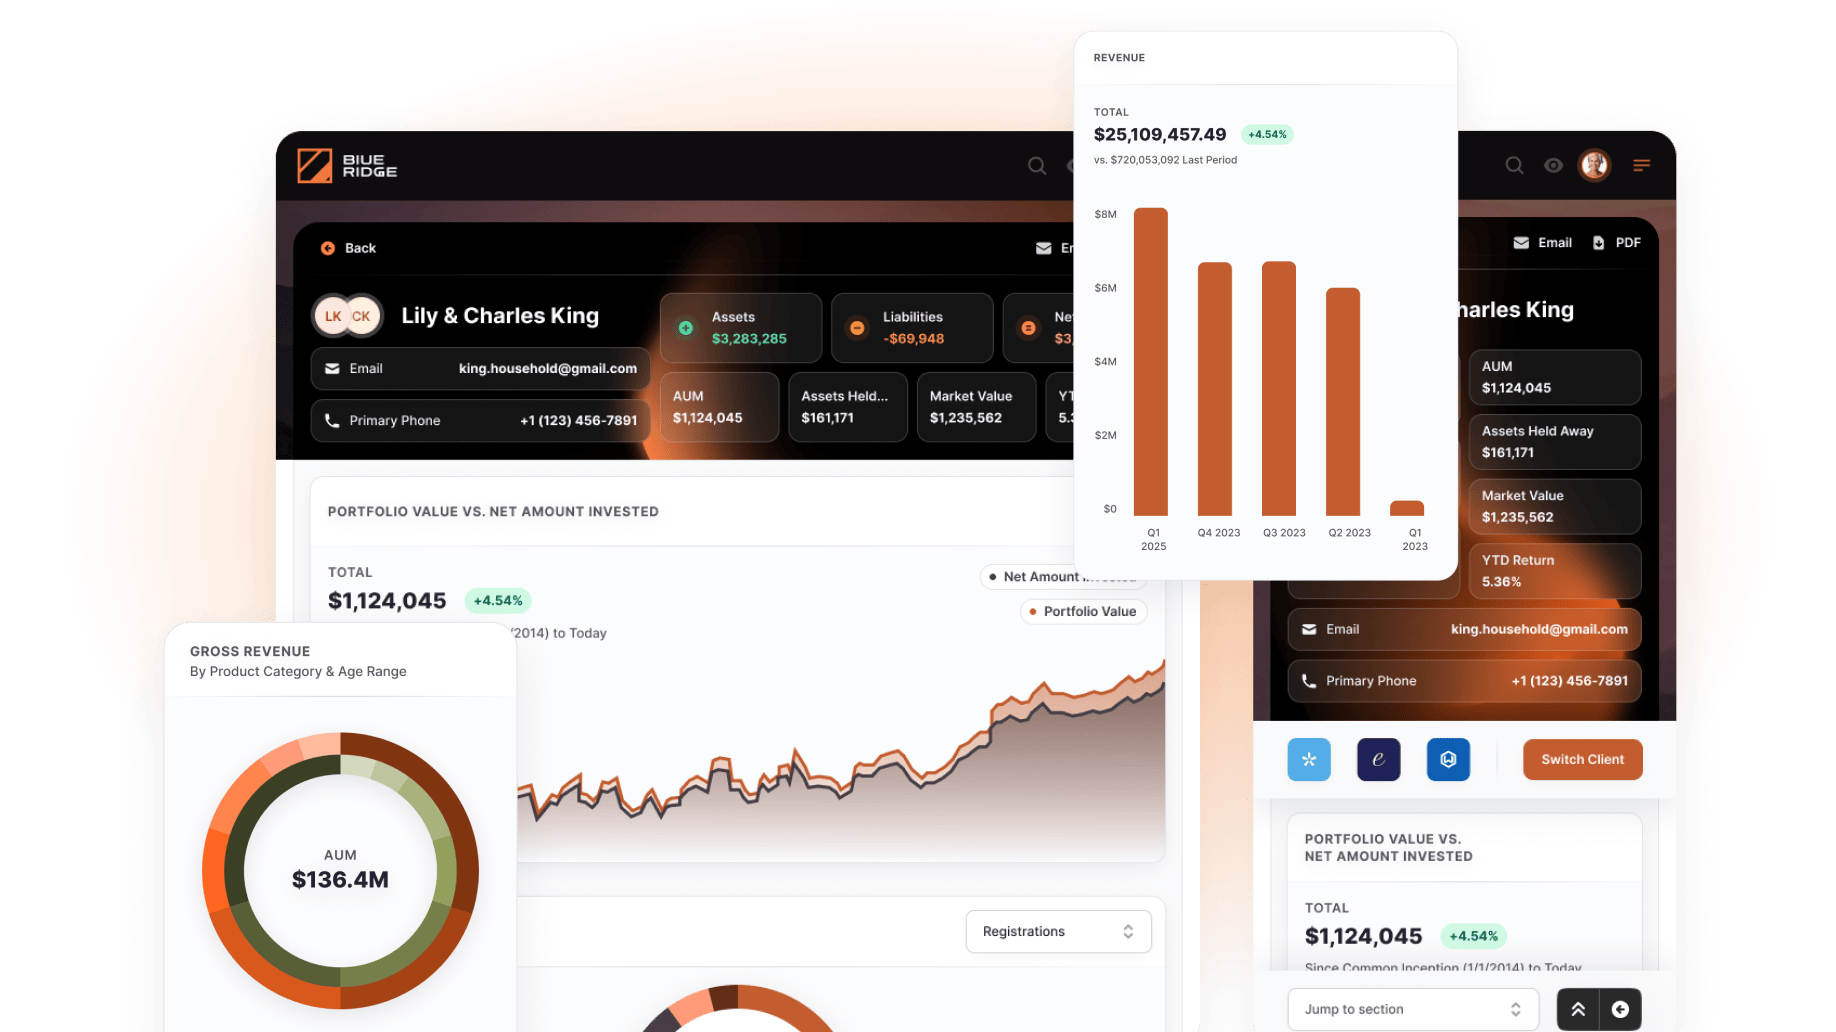
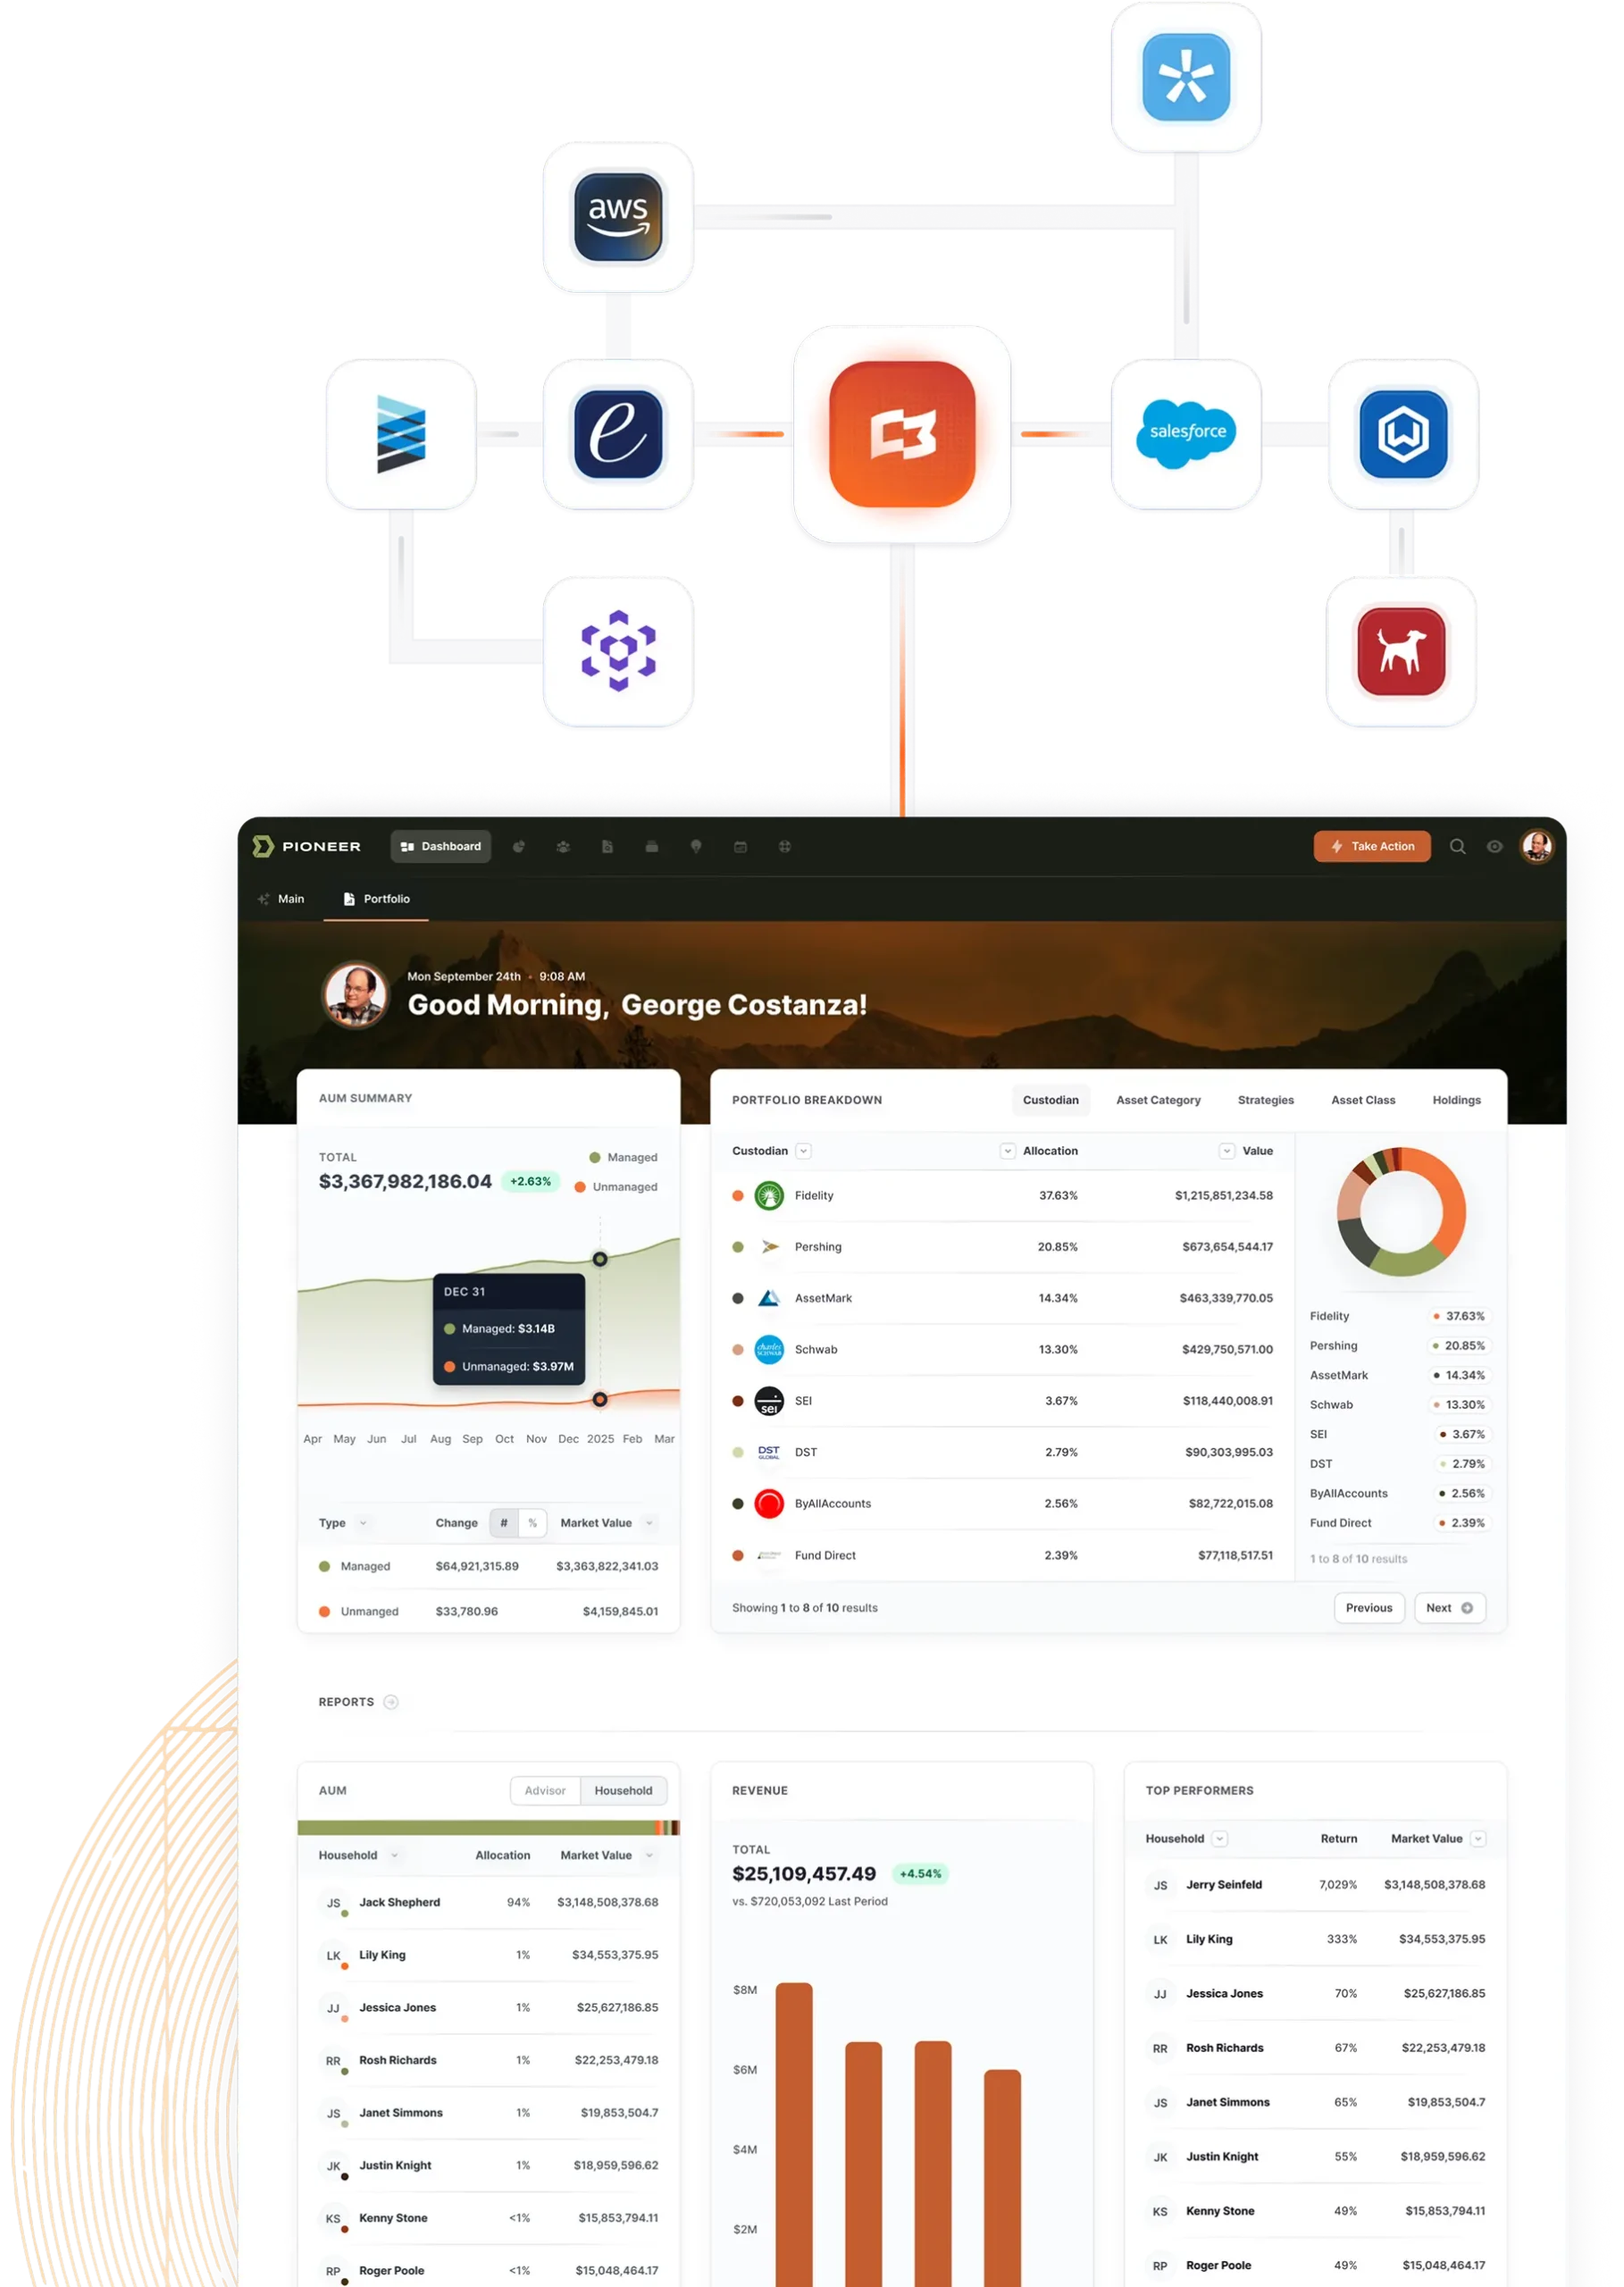
Pie chart illustrating investment distribution in a unified investment management platform, highlighting portfolio visibility across asset classes.

Revenue Clarity

Multi-custodial fee data, billing reconciliation, and revenue attribution across advisors, offices, and products.

Light bulb icon representing innovative solutions for financial revenue reporting and data management.

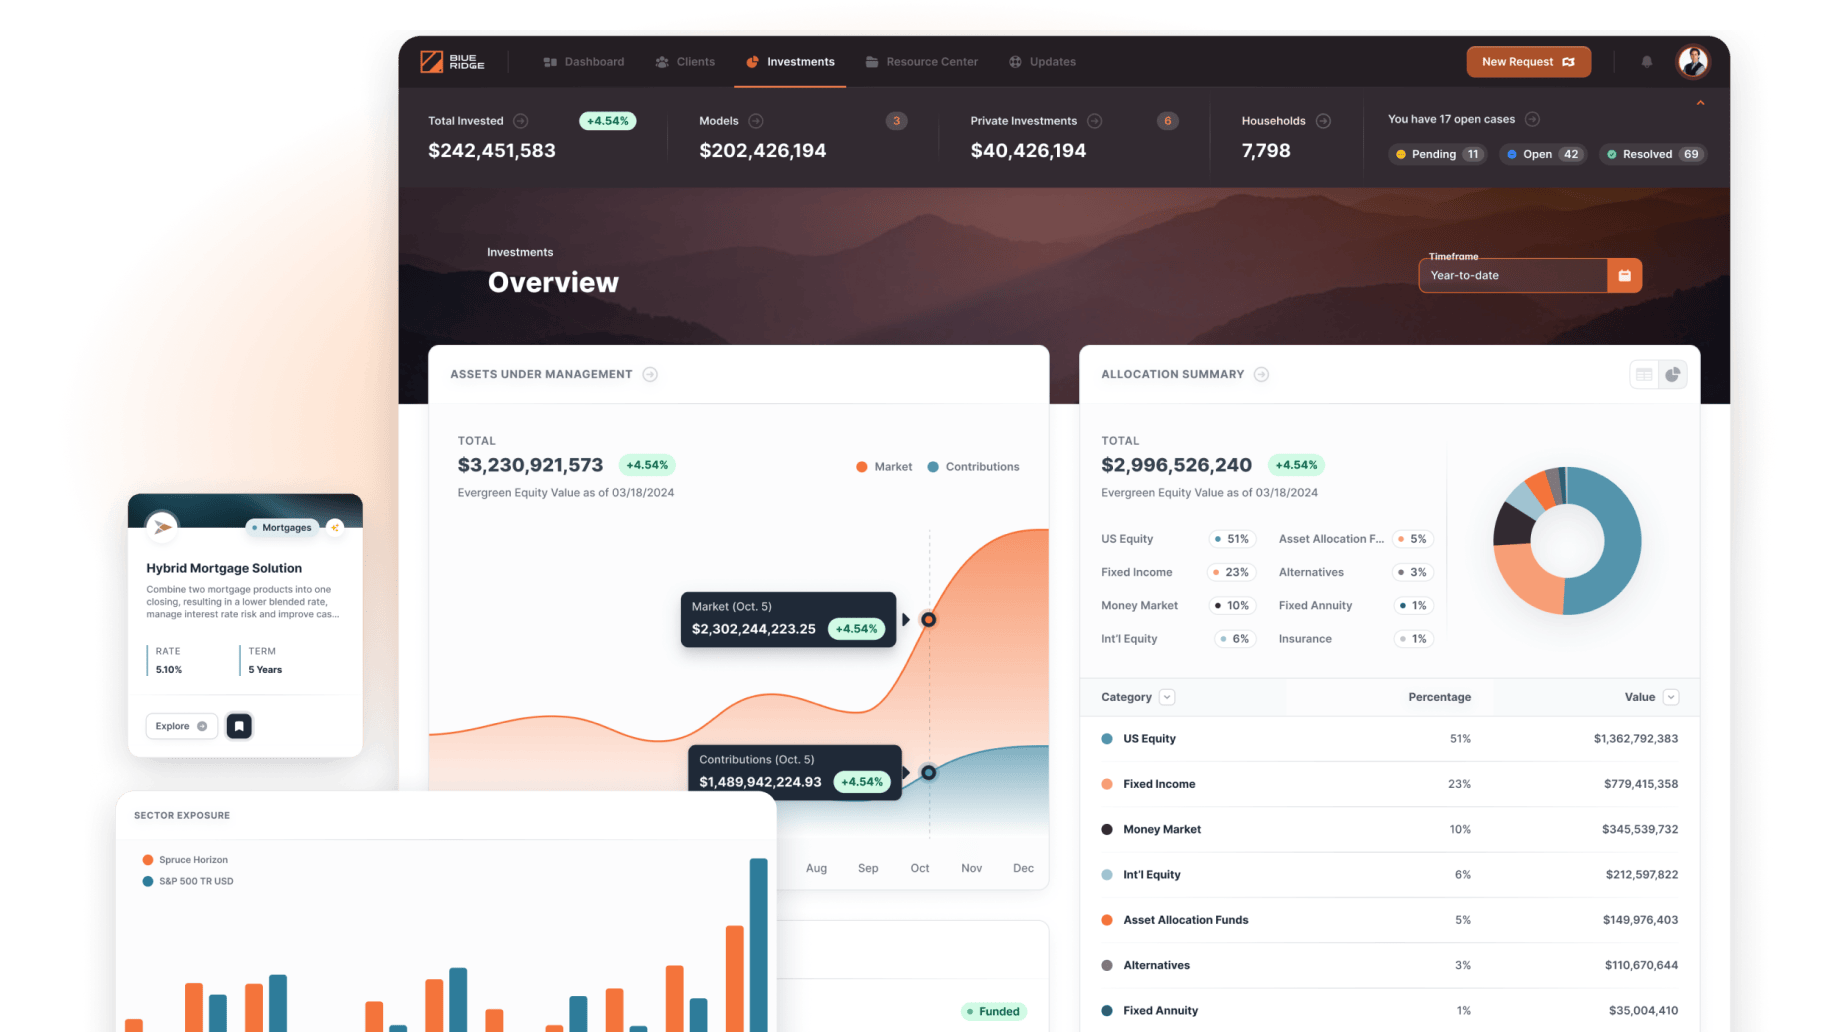
Financial Intelligence

Cost allocation, margin analysis, and profitability insights that actually help you optimize the business.

Clipboard document list icon representing streamlined account opening and data management processes in Milemarker™ platform.

Audit-Ready Data

Complete transaction trails, automated reconciliation, and compliance reporting that makes audits painless.

The Transformation

  • Month-end close = 15+ days

  • Payout disputes = weekly headaches

  • Revenue reports = manual Excel nightmares

  • Board questions = "let me get back to you"

Clock icon representing timely data aggregation and decision-making in Milemarker™ Solutions.

Month-end close

Orange circular icon featuring two horizontal white equal signs, representing balance and accuracy in revenue reporting for financial firms.

3 days

Shield icon with a checkmark, symbolizing security and trust in wealth management solutions by Milemarker.

Payout disputes

Orange circular icon featuring two horizontal white equal signs, representing balance and accuracy in revenue reporting for financial firms.

eliminated

Bar chart illustrating workflow improvements and data accuracy in integrated processes for Milemarker™ Platform.

Revenue reports

Orange circular icon featuring two horizontal white equal signs, representing balance and accuracy in revenue reporting for financial firms.

click a button

Line chart illustrating revenue reporting automation, emphasizing streamlined processes and improved accuracy for financial firms.

Board questions

Orange circular icon featuring two horizontal white equal signs, representing balance and accuracy in revenue reporting for financial firms.

answered instantly

Real CFO Results

Thanks to Milemarker™, our leadership team and advisors now have greater access to the data we need to effectively run our business.

Picture of Laura Hubbell

Laura Hubbell

Chief Information Officer at SignatureFD

Banknotes icon representing financial data and profitability insights for business management and decision-making.

Automated

multi-custodial revenue reporting

Pie chart illustrating distribution analytics and data-driven insights for asset management, emphasizing performance metrics and advisor engagement.

Real-time

profitability by advisor/office

Yellow clock icon representing efficiency in account opening processes, emphasizing speed and reduced manual data entry for Milemarker™ platform.

80%

faster month-end close

Yellow lightning bolt icon representing fast, reliable data transmission for advisor platforms in Milemarker™ Solutions.

Zero payout

reconciliation errors

What CFOs Get

Banknotes symbolizing alternative investments and unified financial management in the Milemarker™ platform.

Compensation Management

  • Automated grid calculations and overrides

  • Real-time payout previews for advisors

  • Multi-tier commission structures

  • Bonus and incentive tracking

Bar chart illustrating workflow improvements and data accuracy in integrated processes for Milemarker™ Platform.

Financial Reporting

  • Revenue by advisor, office, and product

  • Cost allocation and margin analysis

  • Multi-custodial fee reconciliation

  • EBITDA and profitability dashboards

Arrow trending upward symbolizing growth and revenue increase in financial reporting.

Optimization Insights

  • Advisor productivity benchmarking

  • Client profitability analysis

  • Service line performance tracking

  • Growth opportunity identification

Scale icon representing data processing and integration for Milemarker platform.

Compliance & Audit

  • Complete transaction audit trails

  • Automated regulatory reporting

  • SOC 2 compliant data handling

  • Role-based access controls

Built For

CFO Workflows

Real-Time Dashboards

See your numbers update as transactions happen. No more waiting for month-end.

Dashboard interface displaying financial data, including portfolio values, revenue trends, and client information, emphasizing automated revenue reporting and advisor transparency.

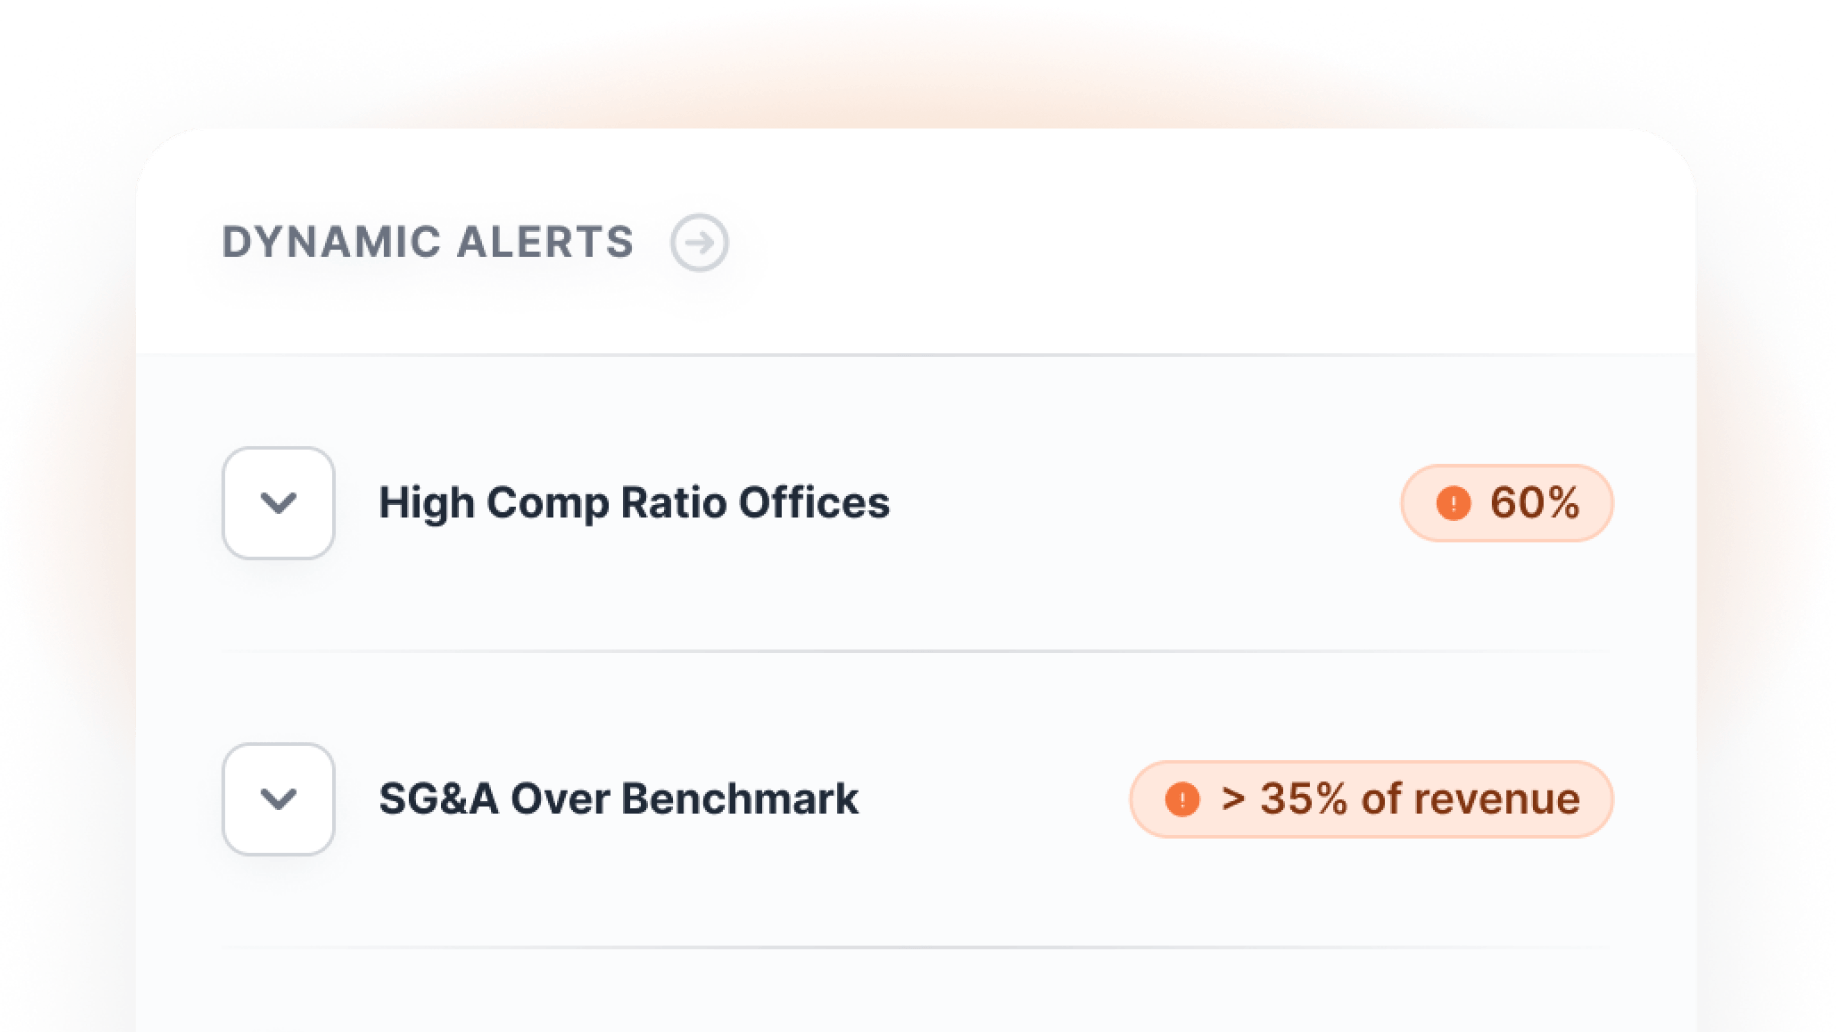
Exception Management

Get alerts when something’s off. Catch problems before they become headaches.

Dynamic alerts interface displaying "High Comp Ratio Offices" at 60% and "SG&A Over Benchmark" exceeding 35% of revenue, emphasizing operational efficiency and exception management for COOs.

Automated Reports

Board decks, management reports, and compliance filings that build themselves.

Dashboard interface displaying investment overview, including total assets under management, market trends, contributions, and allocation summary for diverse investment categories, emphasizing unified investment management solutions.

Integration Ready

Works with your existing accounting, payroll & ERP systems.

Visual representation of financial technology integration, showcasing various application icons connecting to a central system, leading to financial insights and data normalization for CFOs.

Implementation That Works

  • Your auditors will love the clean data trails.

  • Your advisors will love the payout transparency.

  • You'll love having your life back.

Orange circular icon with the number one, representing Milemarker’s focus on wealth management solutions and data ownership.
Week 1:

Connect accounting and payout systems

Share icon representing Milemarker’s wealth management software solutions and data integration capabilities.
Orange circular icon with the number 2, representing Milemarker's wealth management software functionalities and user data management.
Week 2:

Configure compensation rules and reporting

Cog graphic representing streamlined data flow and automation for client onboarding processes in financial services.
Orange circular icon with the number 3, symbolizing Milemarker's data management solutions for wealth management.
Week 3:

Validate numbers & train your team

Group of users icon representing collaboration and partnership in enterprise data solutions for CTOs.
Orange circular icon with the number 4, representing Milemarker™ solutions for operational excellence and technical support in enterprise data infrastructure.
Week 4:

Run your first automated close

Rocket icon symbolizing investment innovation and streamlined financial solutions on Milemarker™ platform.
Dashboard interface displaying portfolio management metrics and data visualization, featuring a greeting to the user, AUM summary, portfolio breakdown by custodians, and integration icons for various financial technologies.
Also built for:
Milemarker logo in white, representing a financial advisory business focused on serving, specializing, and scaling for growth.

Ready to Automate
Your Close?

Stop spending weeks on work that should take hours.

Quantify the time and cost savings.

See automated payouts and revenue reporting in action.

How other CFOs transformed their operations.

Icon of a lightning bolt symbolizing efficiency and automation in integrated workflows for Milemarker™ Platform.

Stop Playing Defense

Move from reactive reconciliation to proactive optimization.

Shield icon with a checkmark, symbolizing security and trust in wealth management solutions by Milemarker.

Trust Your Numbers

Automated calculations mean no more second-guessing your data.

Light bulb icon representing innovative solutions for financial revenue reporting and data management.

Focus on Strategy

Spend time analyzing the business, not building spreadsheets.

Server stack graphic representing the Milemarker™ platform for financial advisors, illustrating data management and workflow consolidation.

Scale Without Breaking

Your financial infrastructure grows with your business.

The CFO Advantage