- Milemarker™ Solutions
- I AM A
- Firm Leader
Stop Managing Chaos.
Start Leading Growth.
Milemarker™ gives firm leaders what they actually need: control.
- The Leadership Reality
You're Running a Ferrari with a Honda Dashboard
You're Running a Ferrari with a Honda Dashboard
Board meeting. Tuesday. 2pm.
Mental scramble: Text the COO. Wait for Excel. Hope the numbers are right.
“Why are our advisors complaining about technology?”
The eternal question: Add more people? Buy more software? Cross your fingers and hope?
You're leading a sophisticated business with Stone Age intelligence.
- The Control Problem
Your Firm Has Grown Faster Than Your Systems
Process Fragmentation
Onboarding takes weeks. Trading requires PhD-level training. Compliance happens via email and hope.
Data Scattered
Integration Nightmares
Advisor Frustration
Your team spends more time fighting systems than serving clients. Great advisors leave for firms with better tools.
You can't lead effectively when you can't see clearly.
- What Firm Leaders Actually Need
Complete Control Over Your Business

Process Control

Data Control

Integration Control

Advisor Experience Control
What You Get

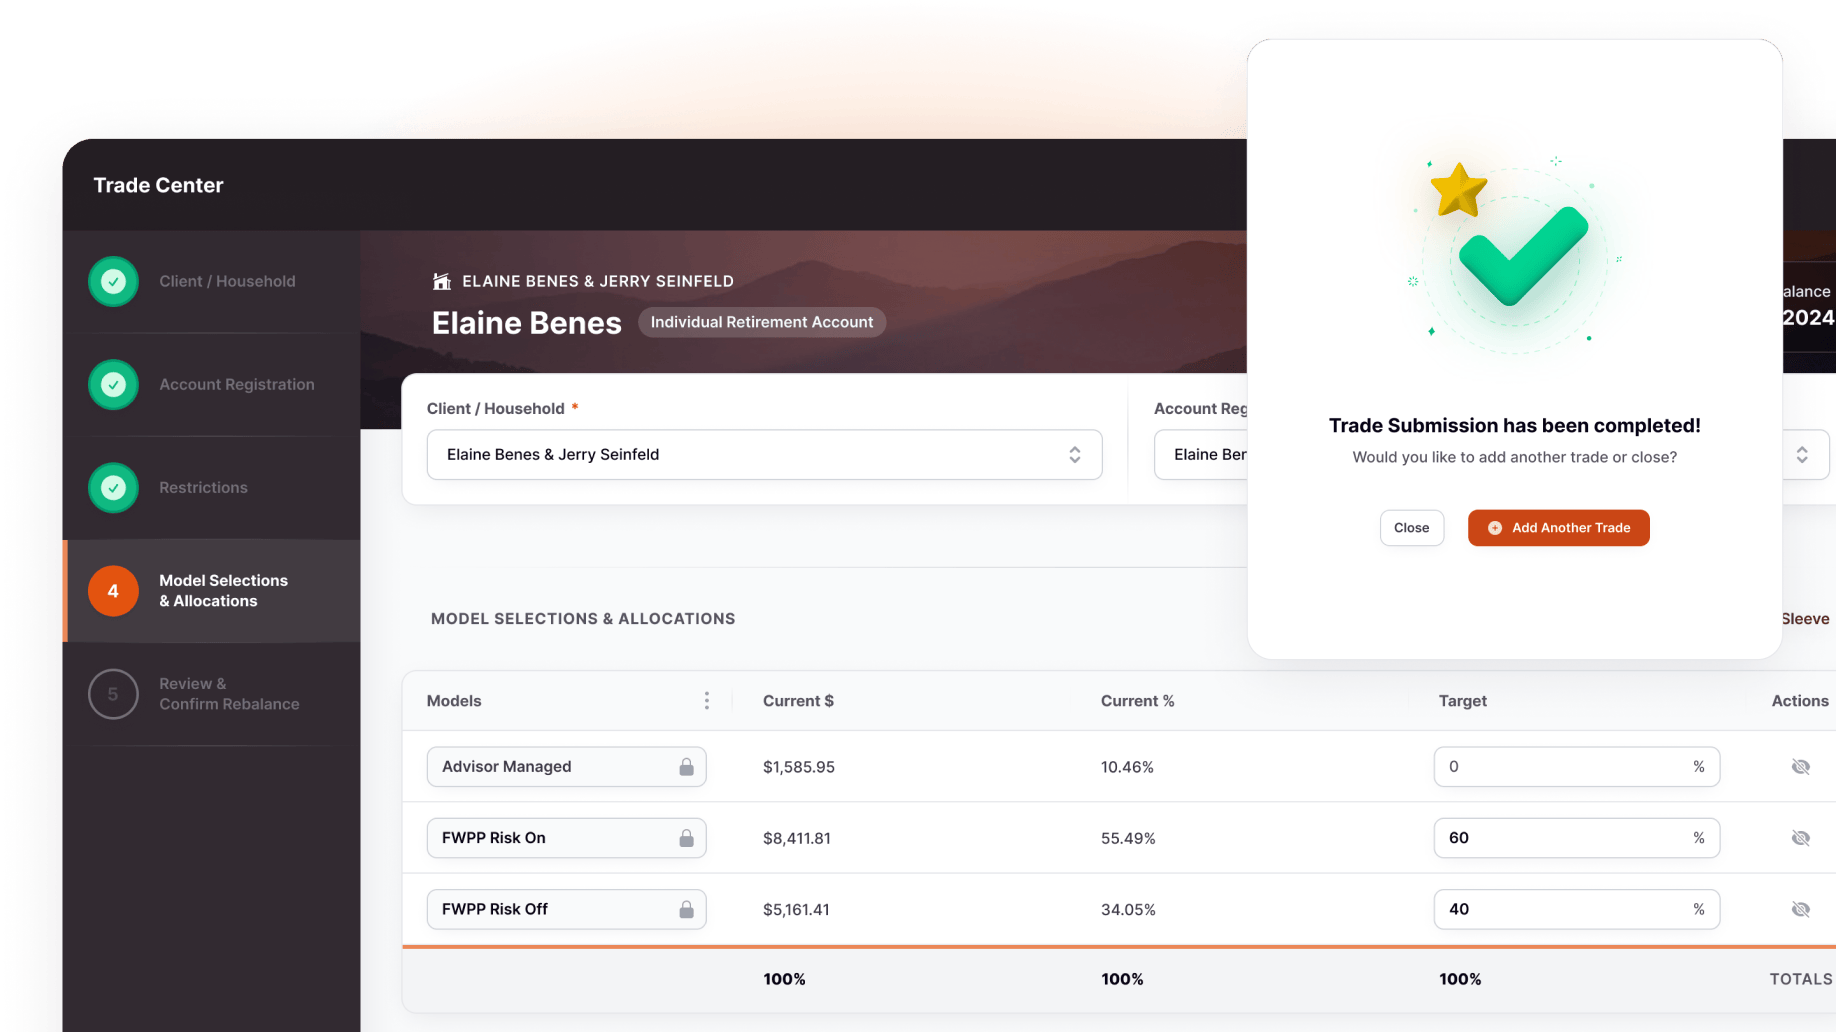
Complete Process Orchestration
-
Automated workflows that eliminate manual handoffs
-
New account opening that works across all custodians
-
Trading systems that advisors actually want to use
-
Compliance monitoring that catches issues before they become problems
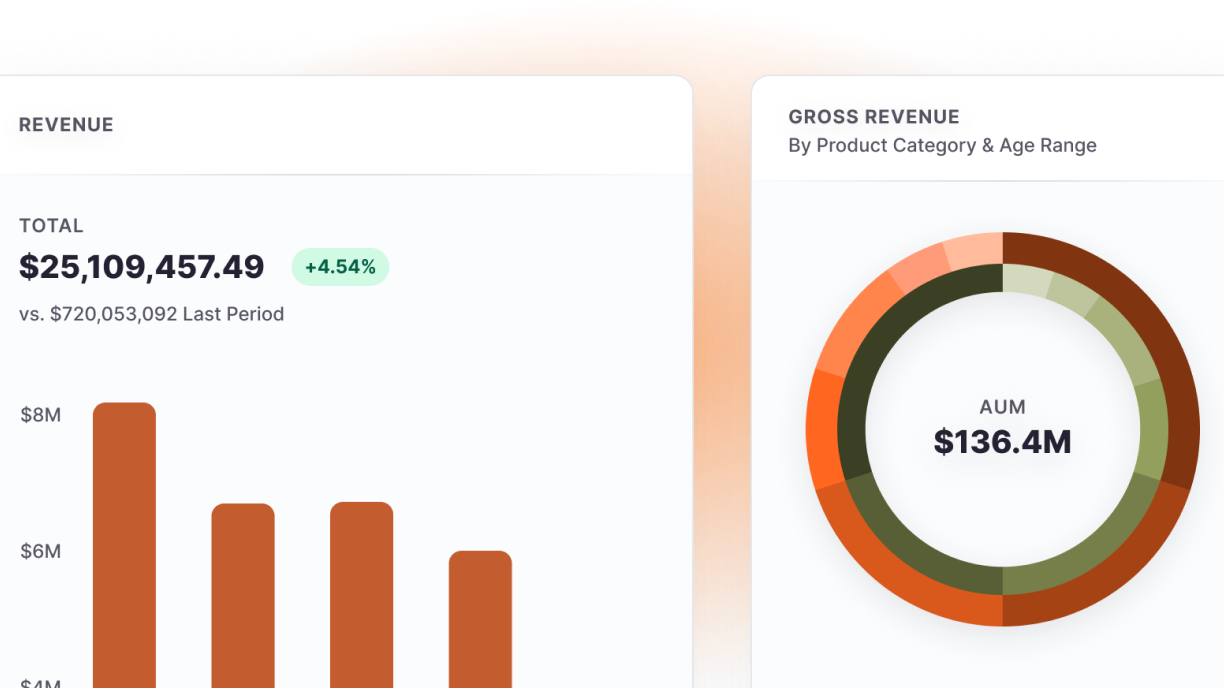
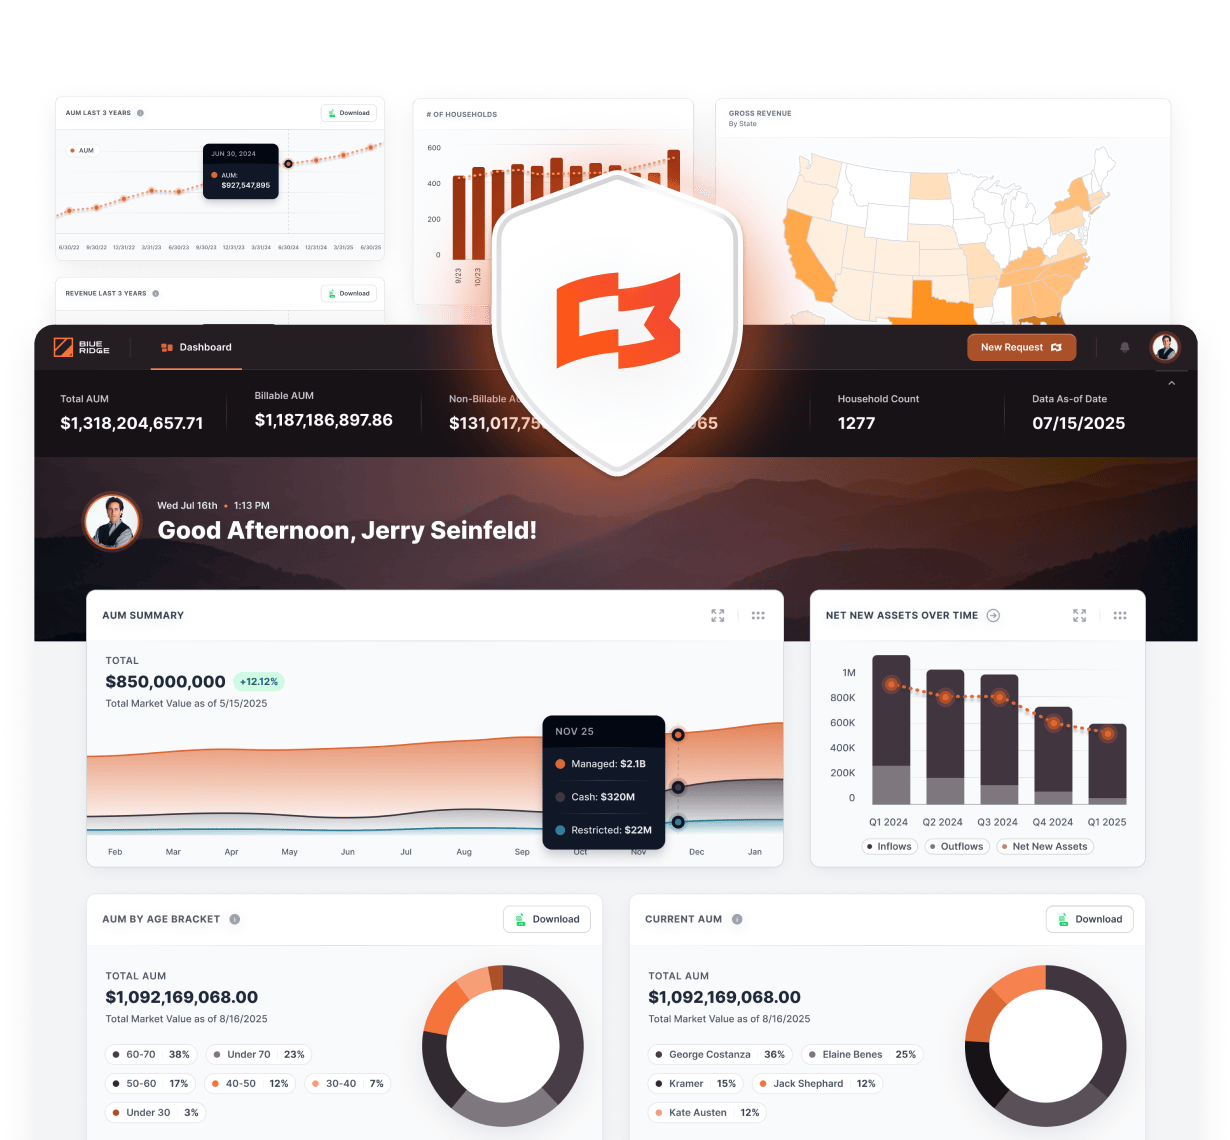
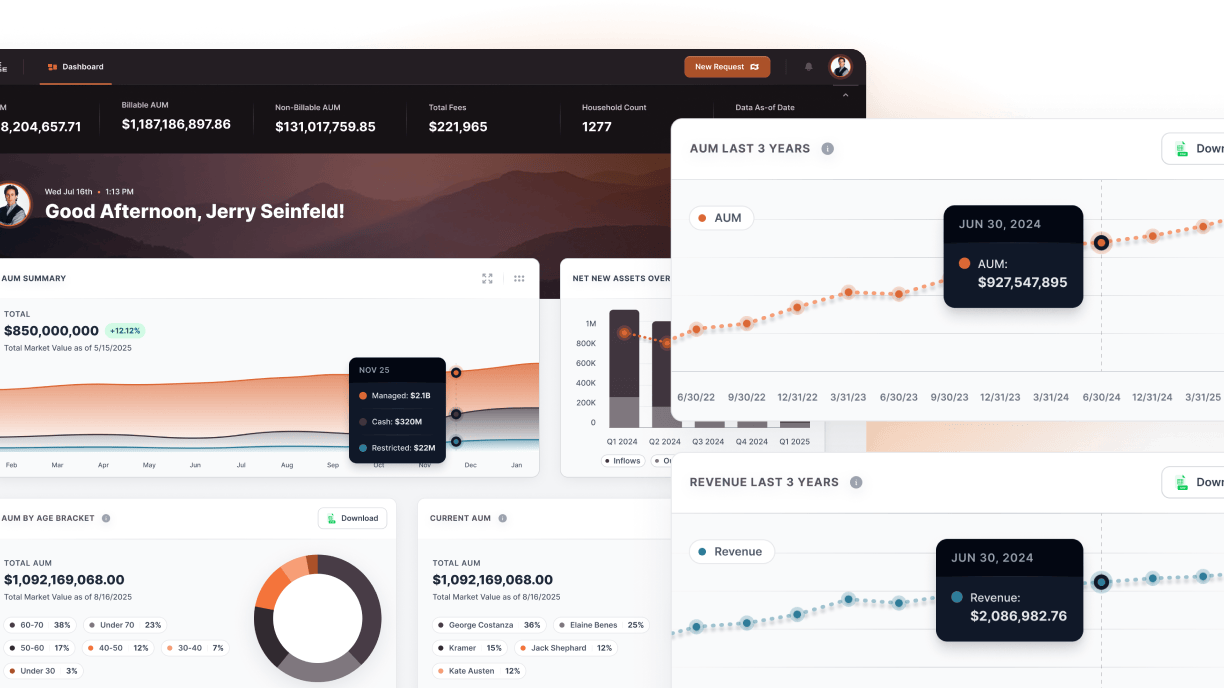
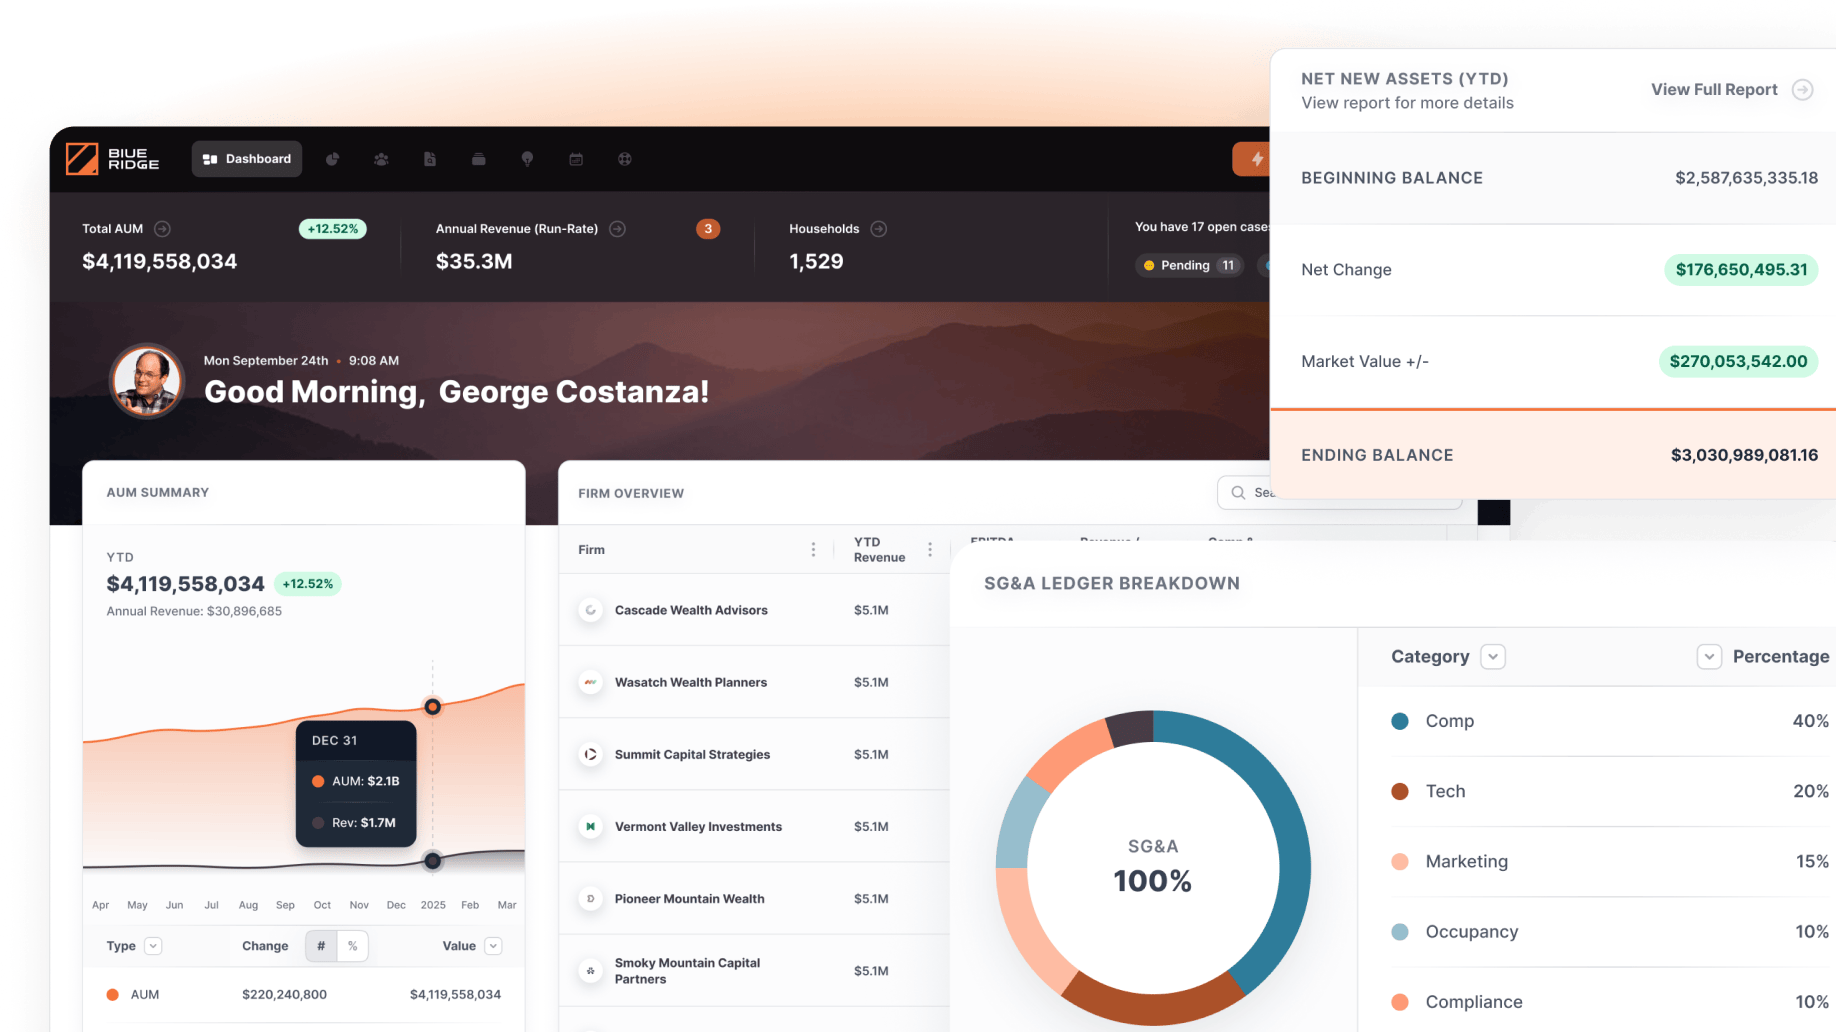
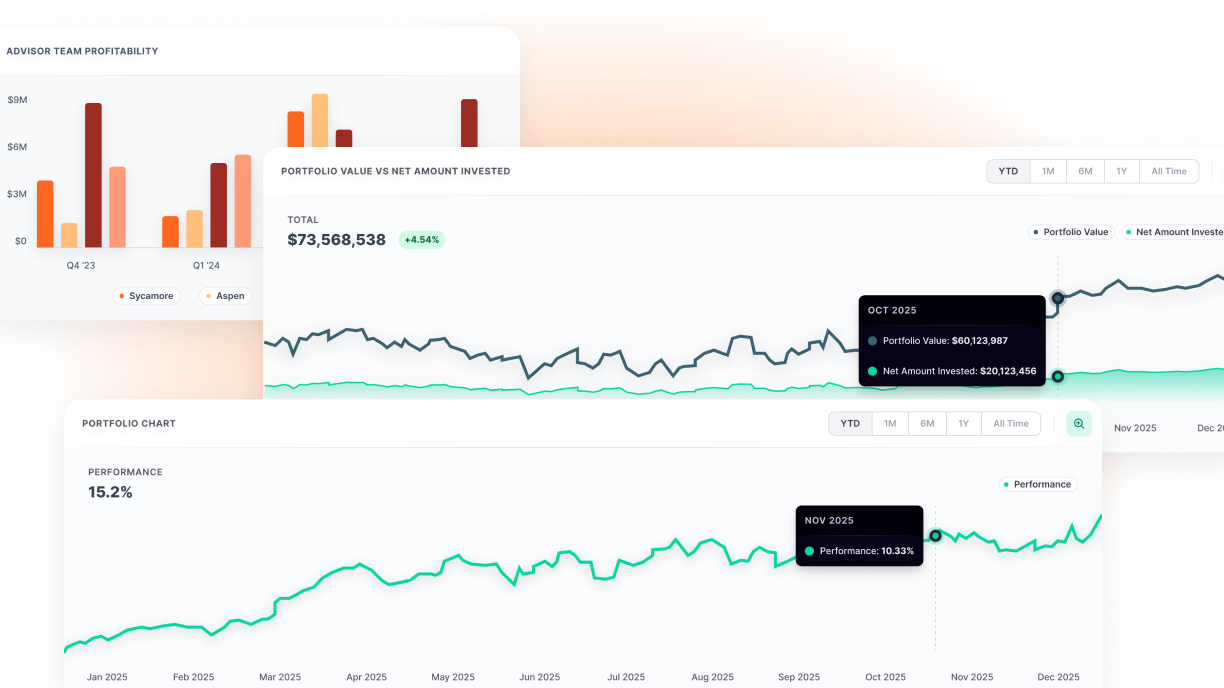
Unified Business Intelligence
-
Real-time dashboards showing what matters most
-
Financial metrics that update automatically across all systems
-
Advisor productivity analytics that drive better decisions
-
Client intelligence that predicts problems and opportunities
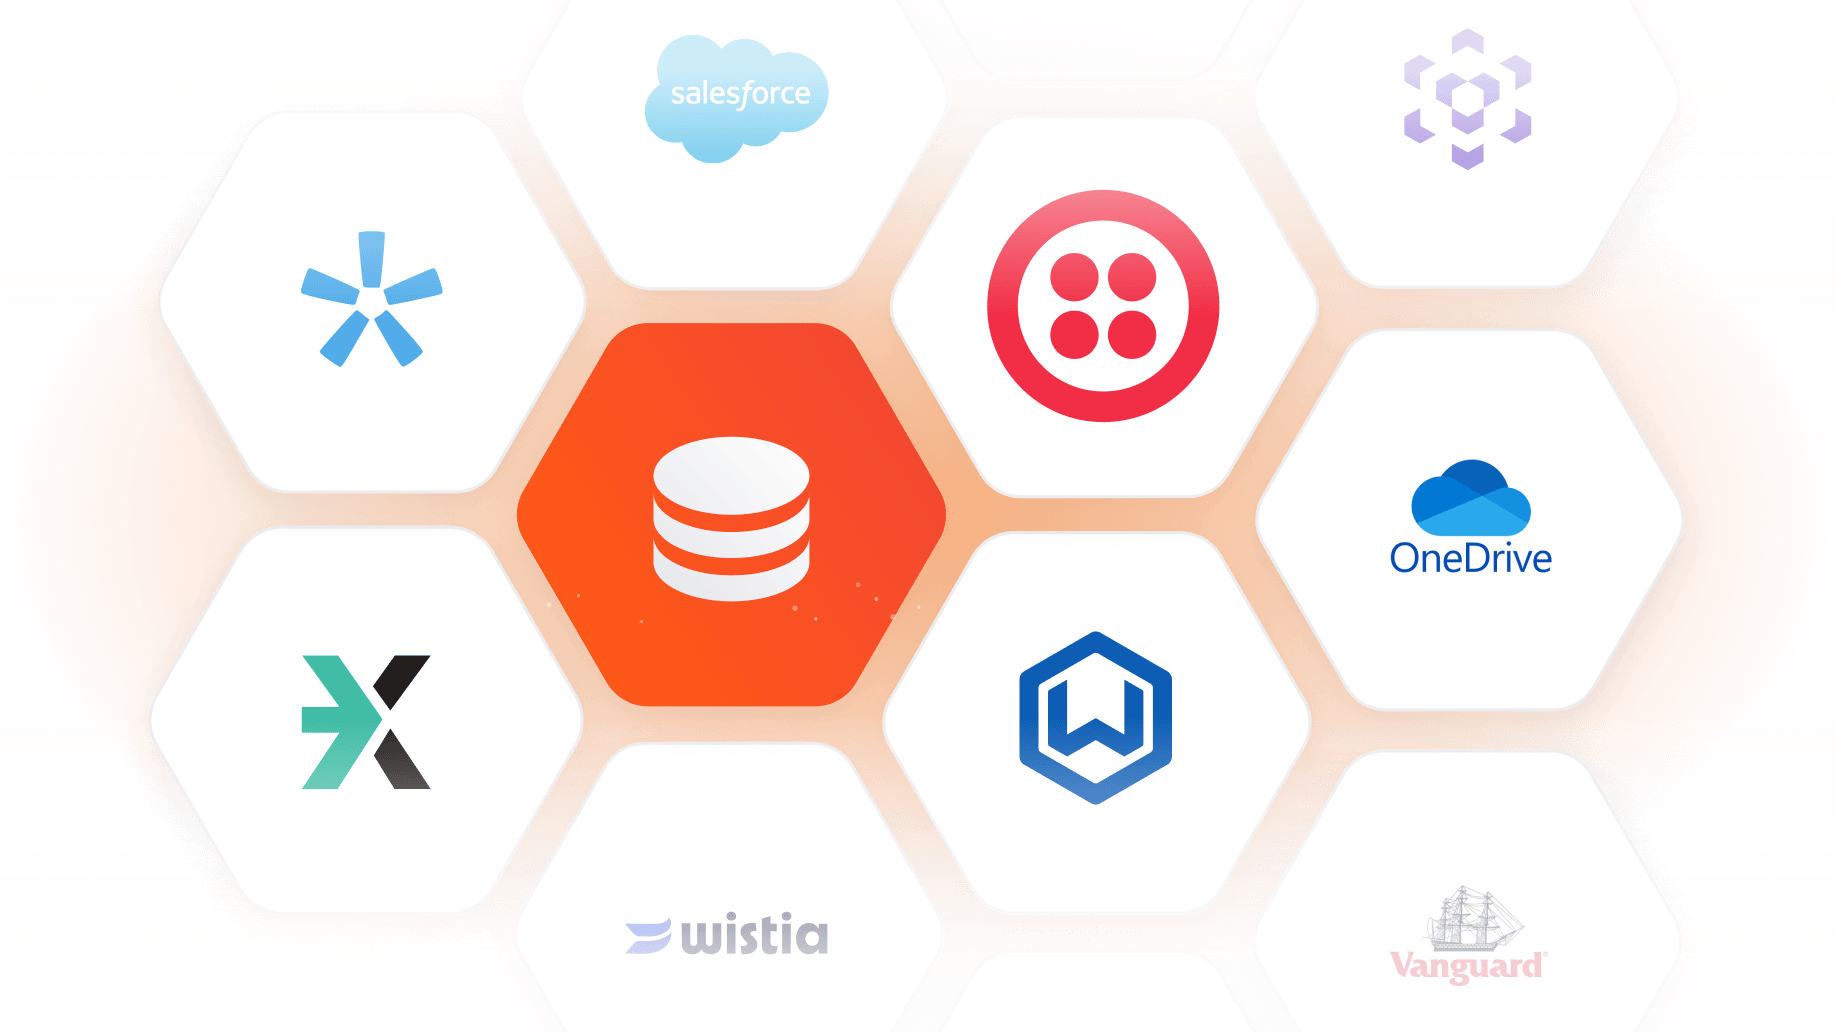
Seamless Integration Architecture
-
130+ pre-built connections to wealth management platforms
-
Single source of truth for all your business data
-
Automated synchronization across CRM, custodians, and portfolio systems
-
Enterprise security that meets institutional standards
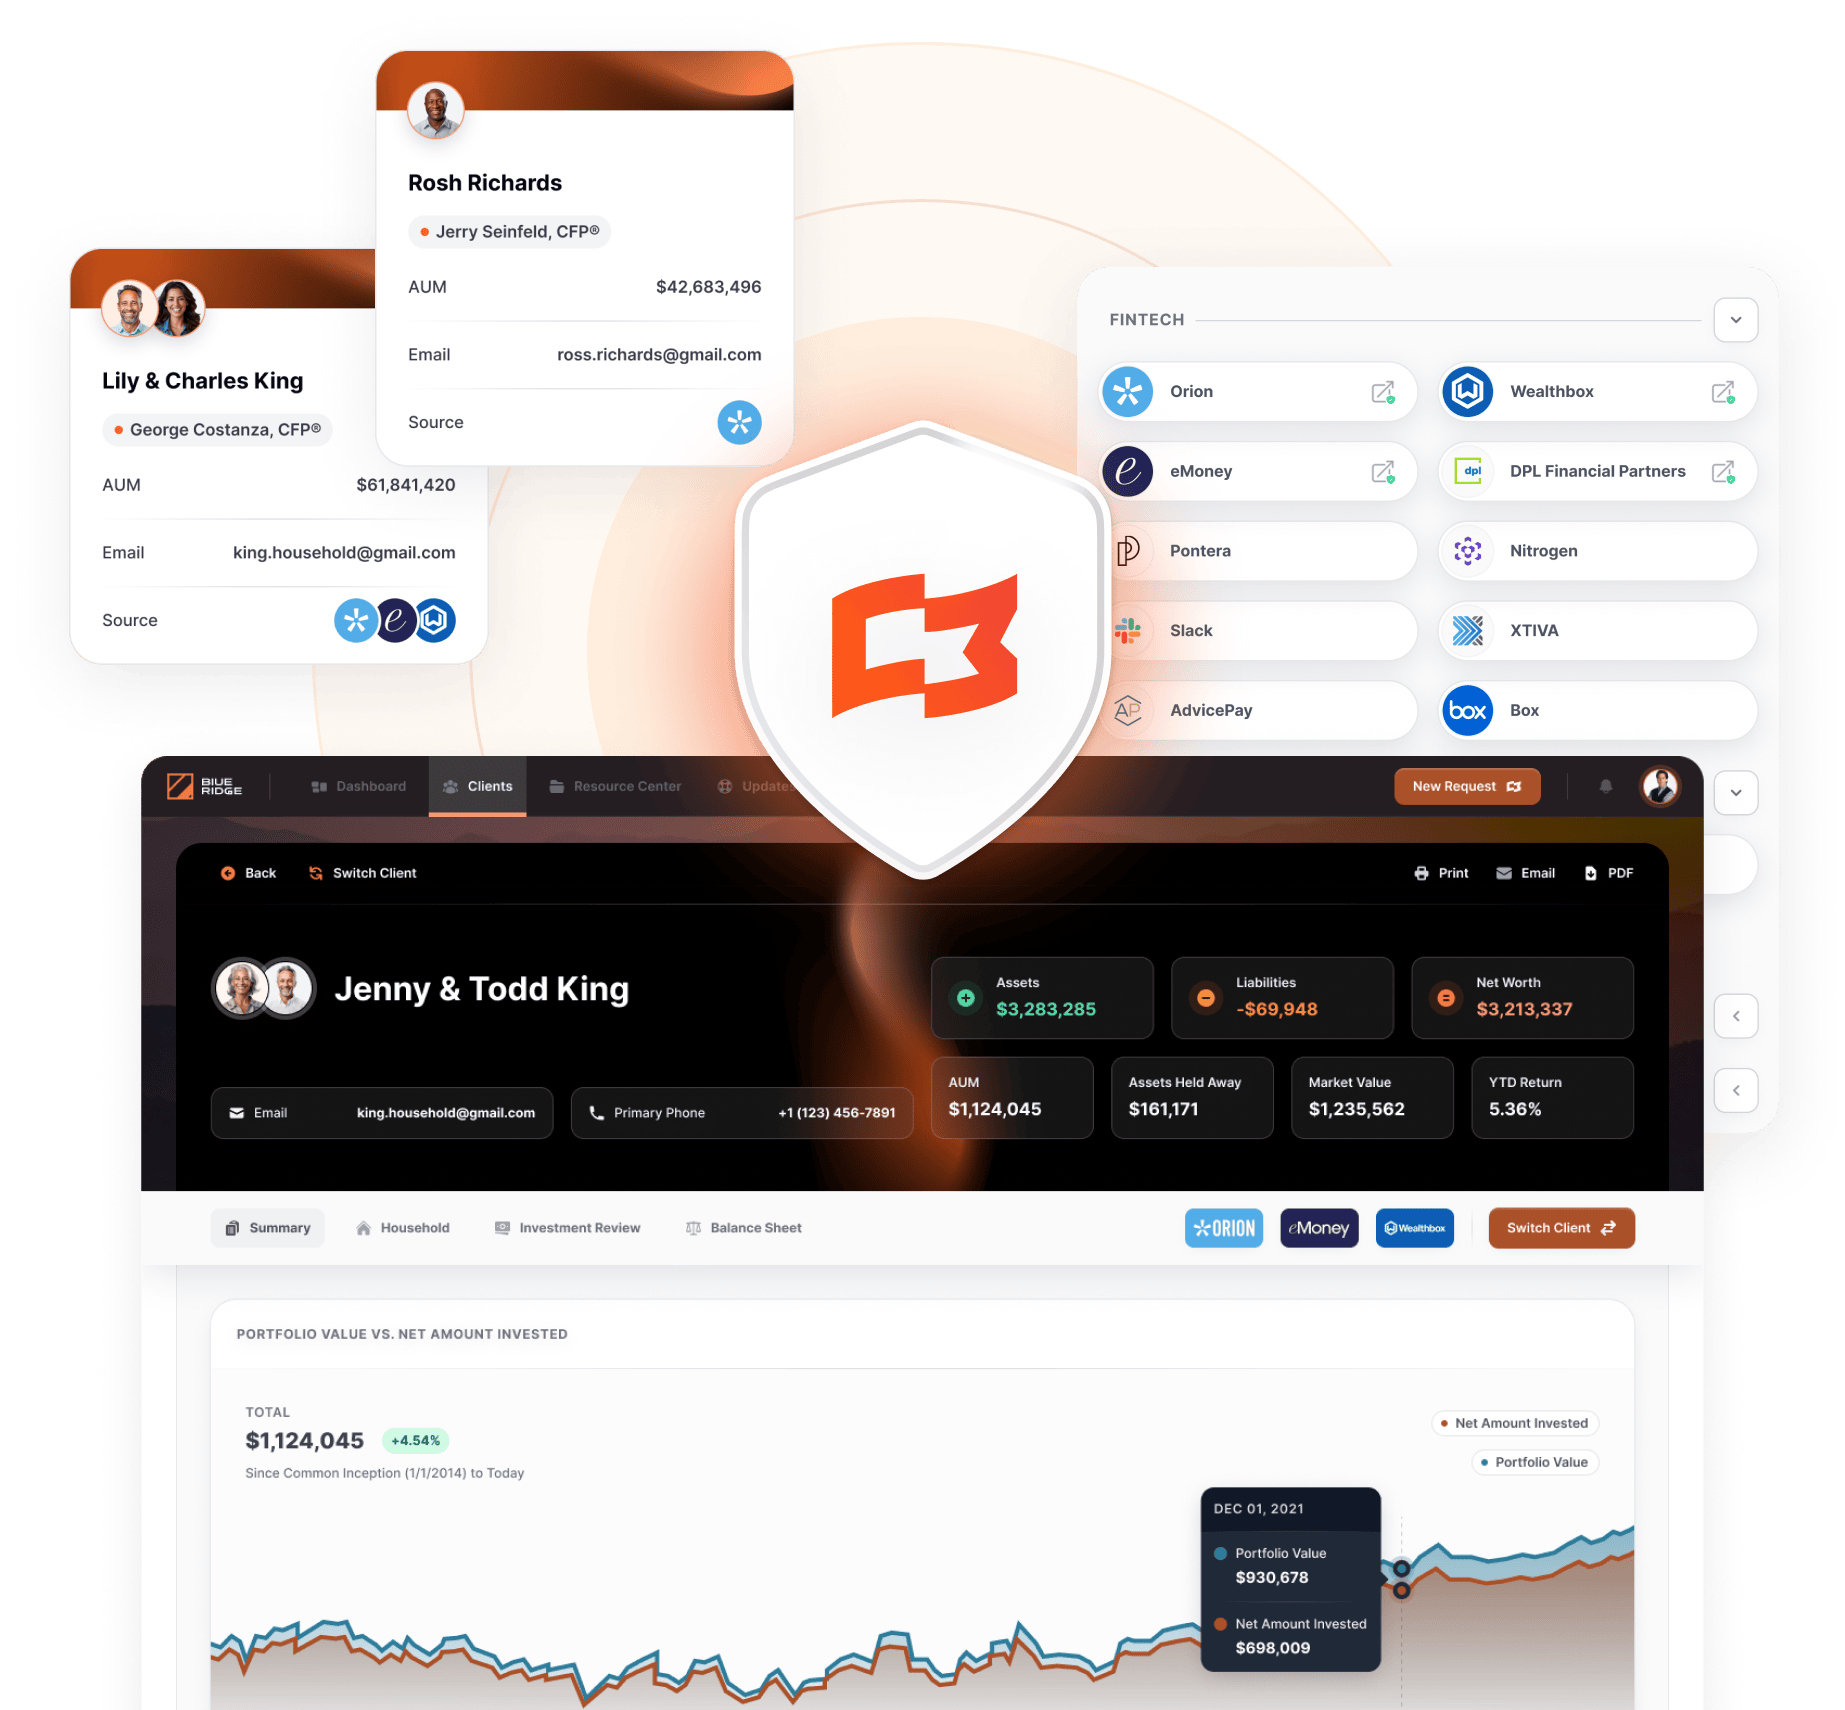
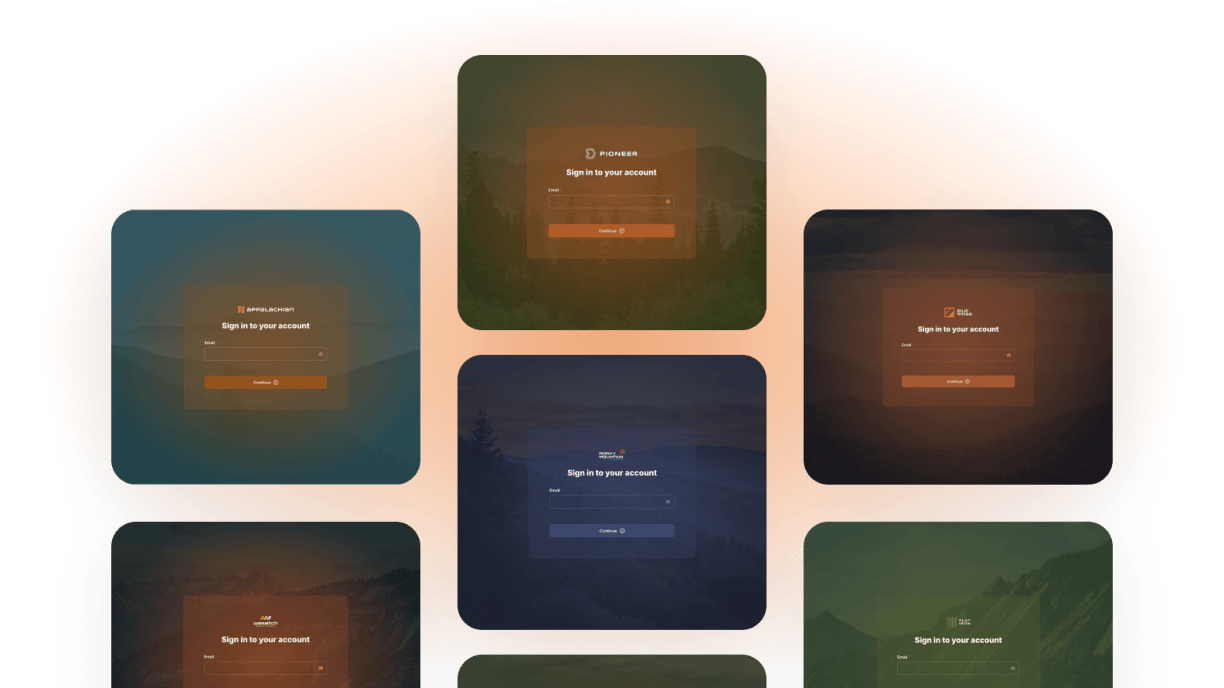
Exceptional Advisor Experience
-
Branded platforms that reflect your firm's identity
-
Unified client views that eliminate tab switching
-
Mobile-optimized tools that work anywhere
-
Self-service capabilities that reduce support burden
The Leadership
Transformation
- Before Milemarker™
-
Strategic decisions = delayed by data gathering
-
Board meetings = "let me get back to you"
-
Advisor complaints = weekly IT fire drills
-
Growth planning = hope your systems don't break
- After Milemarker™

Strategic decisions

backed by real-time intelligence

Board meetings
confident answers to any question

Advisor satisfaction
high-performance tools they love
Growth planning
scalable infrastructure that supports ambition
Real Results
What Milemarker™ does is beyond transformational for the businesses they partner with. Excited to see what is next.

Abby Salameh
Chief Growth Officer, RFG Advisory

75%

Real-time

Unified
advisor experience across all touchpoints

Scalable
Leadership
Control Features
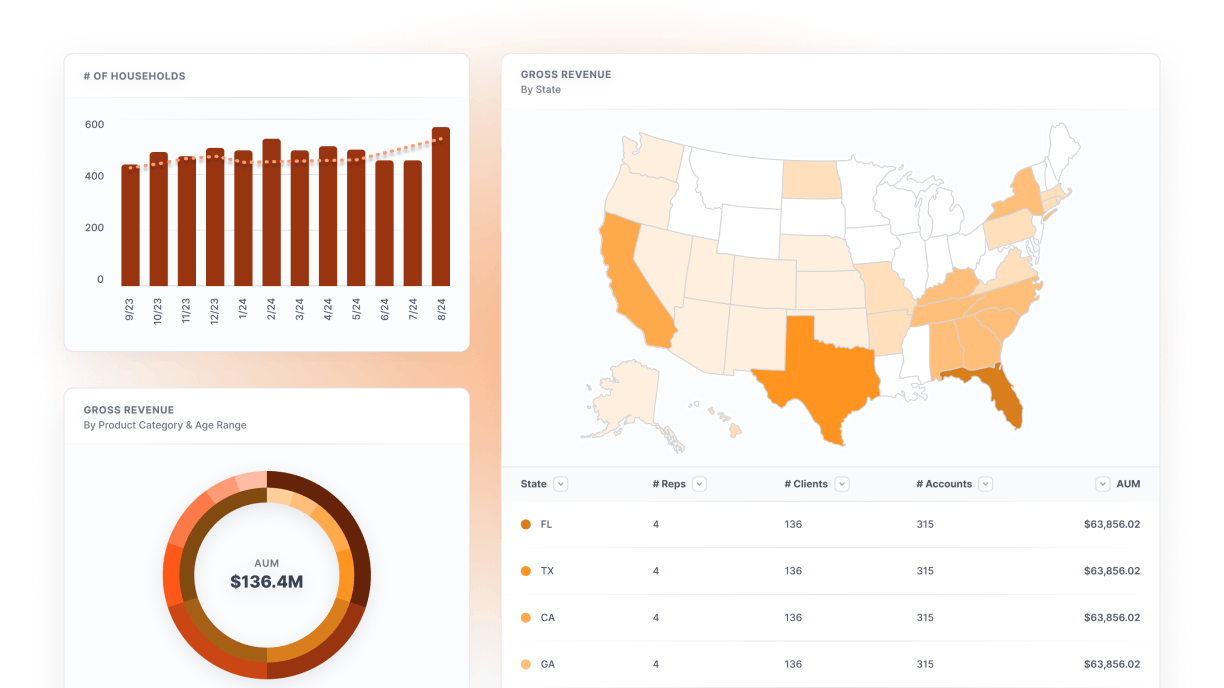
Strategic Intelligence
-
Executive dashboards with real-time business metrics
-
Predictive analytics that identify opportunities & risks
-
Benchmarking tools that show how you compare to peers
-
Scenario modeling for strategic planning & decision making
Operational Excellence
-
Automated workflow management across all business processes
-
Exception monitoring that catches problems before they escalate
-
Resource optimization analytics that improve efficiency
-
Scalability assessment tools for growth planning
Team Empowerment
-
Advisor productivity analytics & development insights
-
Client satisfaction monitoring & improvement recommendations
-
Technology adoption tracking & optimization opportunities
-
Performance management tools that drive results
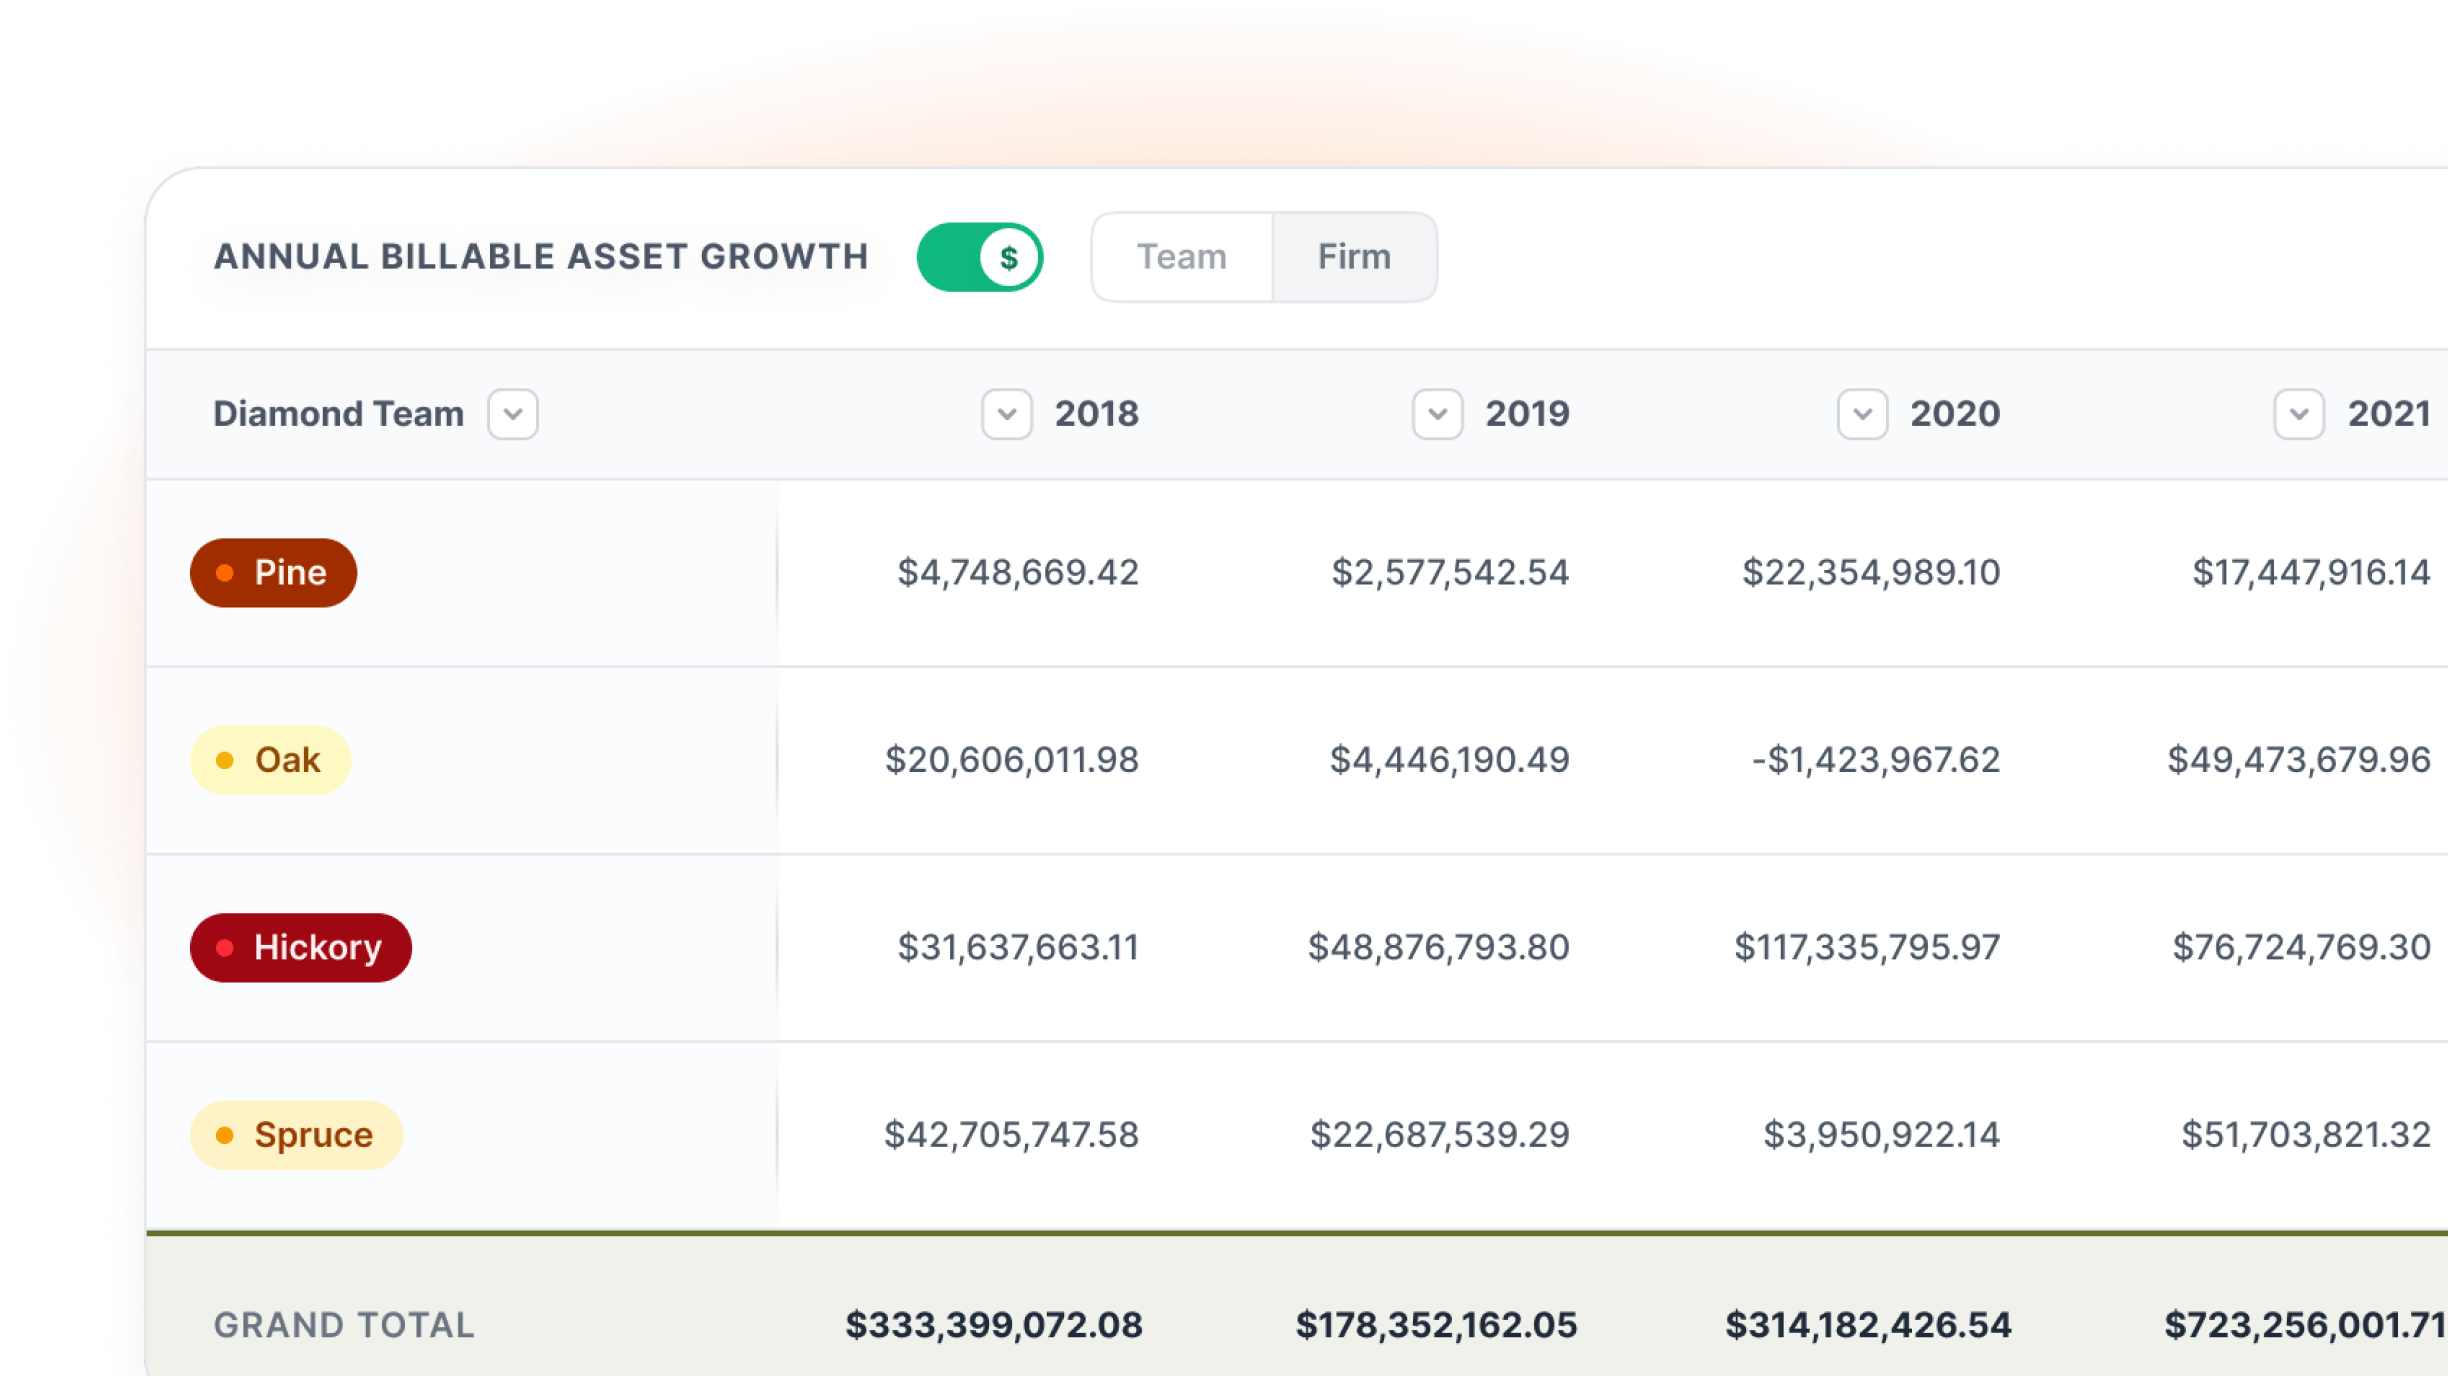
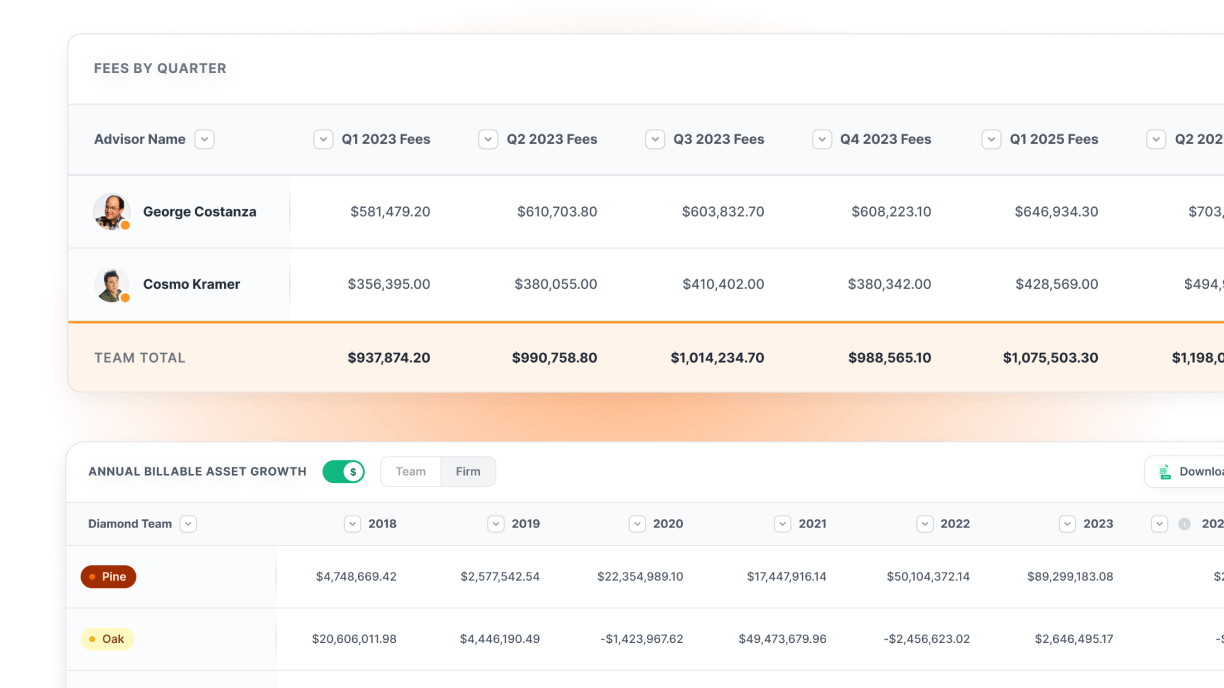
Financial Control
-
Real-time P&L visibility across all business lines
-
Cost allocation & margin analysis by advisor & office
-
Revenue forecasting with confidence intervals
-
Investment ROI tracking for technology & infrastructure
Built For
Leadership Excellence

Enterprise-Grade Security
Enable advisors to build bespoke models and implement unique strategies within your governance framework.

Scalable Architecture
Infrastructure that grows with your ambitions. Add advisors, offices, and services without breaking what works.
Integration Leadership
Connect any system, normalize any data, automate any process. Your technology works for you, not against you.


Brand Consistency
Every client and advisor interaction reflects your firm’s excellence and professional standards.
Advanced
Leadership Capabilities
Multi-Entity Management
-
Oversight across multiple offices, brands, or acquired firms
-
Unified reporting with distributed control & customization
-
Consistent processes with local flexibility where needed
-
Centralized compliance with decentralized operations
Strategic Planning Support
-
Data-driven acquisition target identification & due diligence
-
Market opportunity analysis based on your actual performance
-
Competitive intelligence that guides positioning & strategy
-
Growth scenario modeling with resource requirement planning
Board-Ready Intelligence
-
Automated board packages that update in real-time
-
Key performance indicators aligned with strategic objectives
-
Risk monitoring & mitigation tracking
-
Investor relations support with transparent, audit-grade data
Succession Planning
-
Performance analytics that identify future leaders
-
Knowledge management systems that preserve institutional memory
-
Training & development tracking for key personnel
-
Business continuity planning with data-driven insights
Ready to Lead With Control?
Watch how firm leaders gain complete control over their operations.
45 minutes to map your path from operational chaos to leadership control.

Stop being a systems administrator.
Stop apologizing for broken processes.
Stop accepting "that's just how it works" as an answer.
Why This Matters to Leaders
Every day you spend managing systems is a day not spent leading your firm. Every frustrated advisor is potential talent walking out the door.
As a firm leader, your job is to create the conditions for success—for your team, your clients, and your business.