- Milemarker™ Solutions
- I Want To
- Raise Capital
Your Numbers Tell a Story.
Make Sure It's the Right One.
Turn due diligence into competitive advantage.
- The Capital Challenge
When Investors Call, Are You Ready to Answer?
Monday morning. Your phone rings.
“We’re interested in discussing an investment. Can you send over your financials?”
Panic mode: Export from six systems. Build spreadsheets. Hope the numbers tell a coherent story.
Finally send a patchwork data room that raises more questions than it answers.
Two weeks later:
Investors question your operational sophistication before they even evaluate your growth potential.
The result:
Your opportunity shouldn’t die in data preparation.
- What Investors Actually See
Data Chaos Signals Operational Risk
Inconsistent Metrics
Which advisors are expanding wallets vs. just collecting assets? Your CRM knows, but can’t tell you.
Manual Processes
Spreadsheet-dependent operations scream “can’t scale.” Investors see operational bottlenecks before they see growth potential.
Black Box Reporting
When you can’t explain how you calculate key metrics, investors assume you don’t understand your own business.
Delayed Responses
Every “let me get back to you” signals systems that can’t support rapid growth or investor oversight.
Your data chaos becomes their risk assessment.
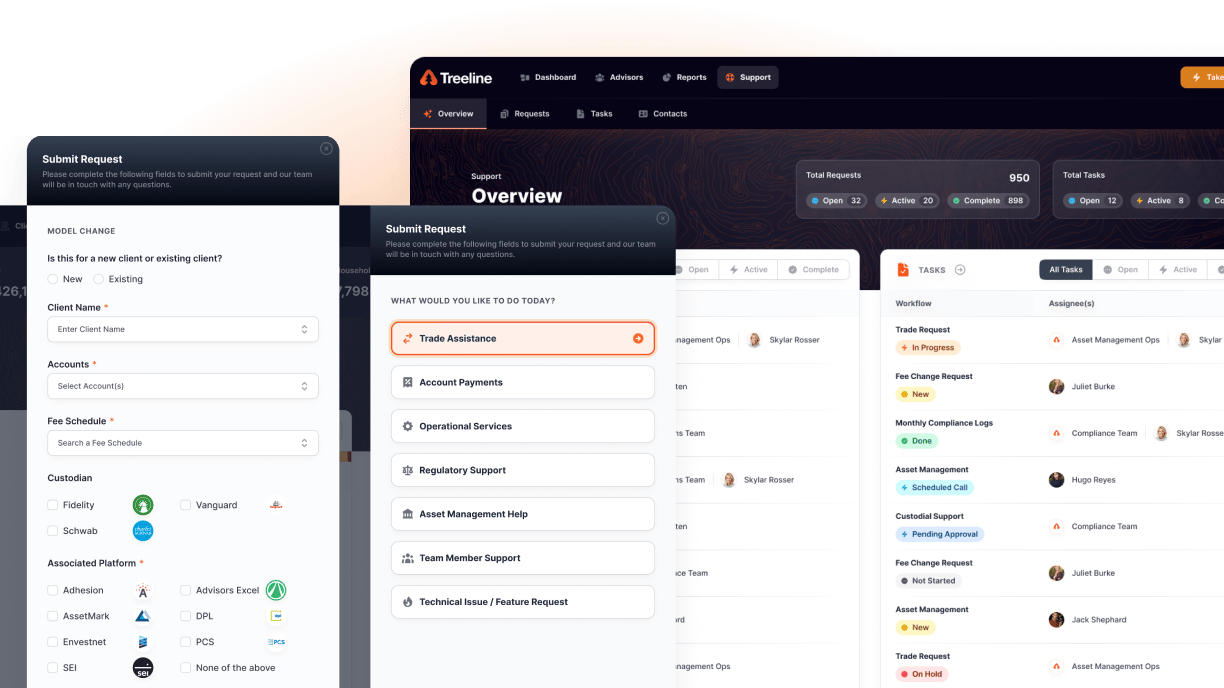
- What We Build
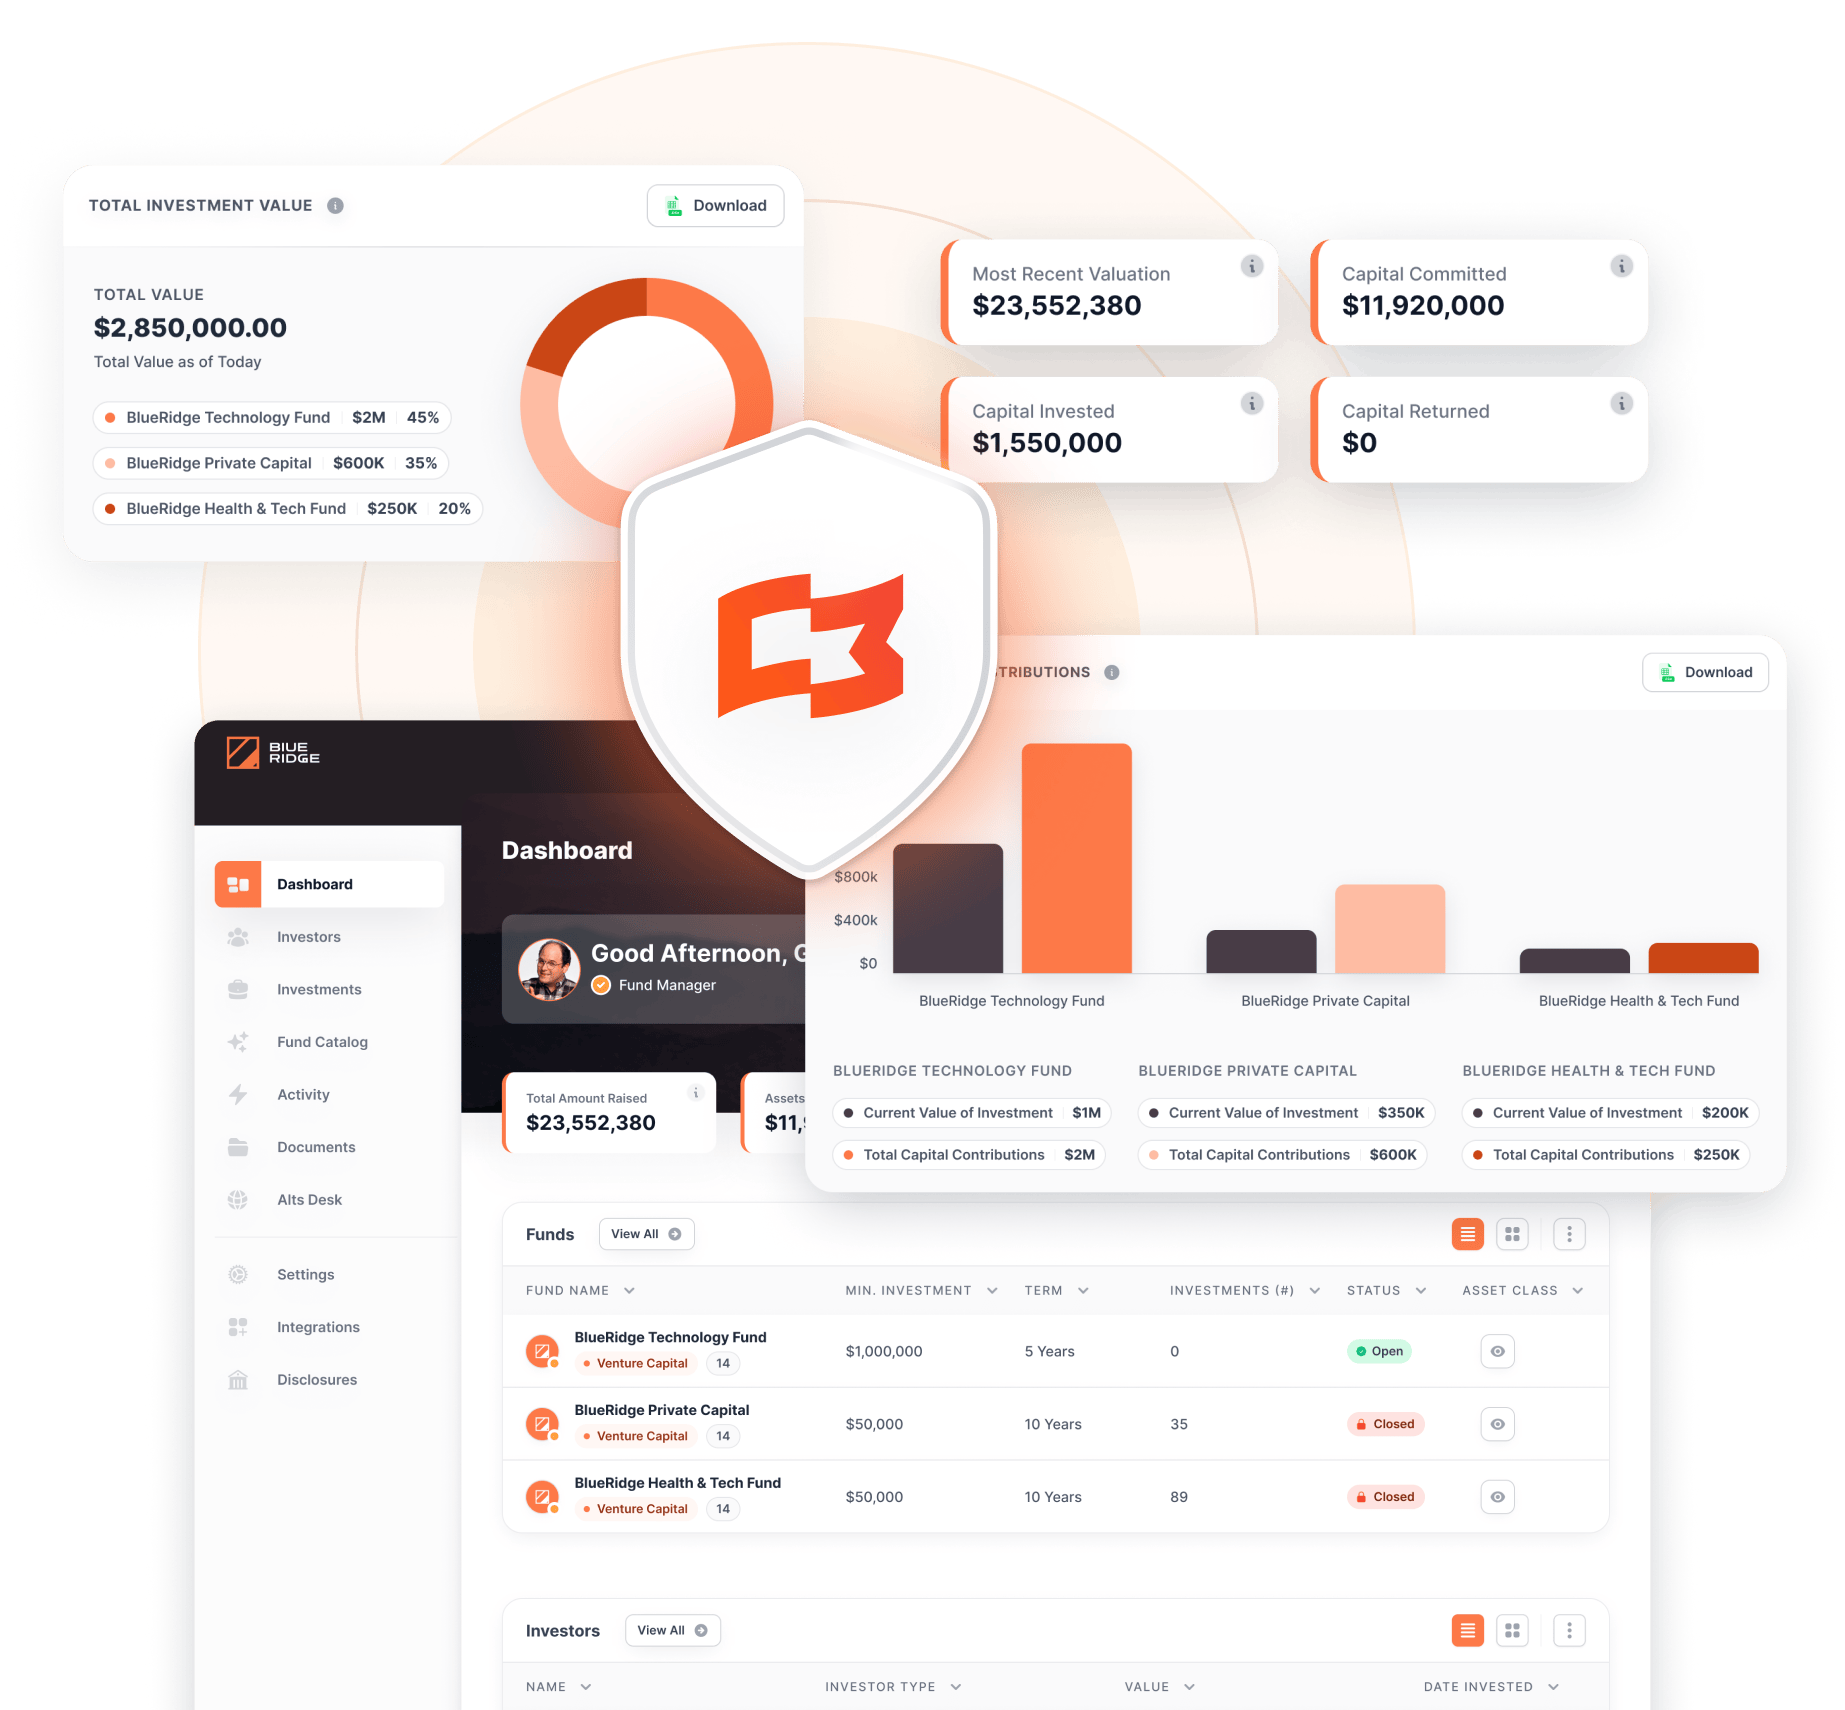
Investor-Grade Intelligence That Opens Doors

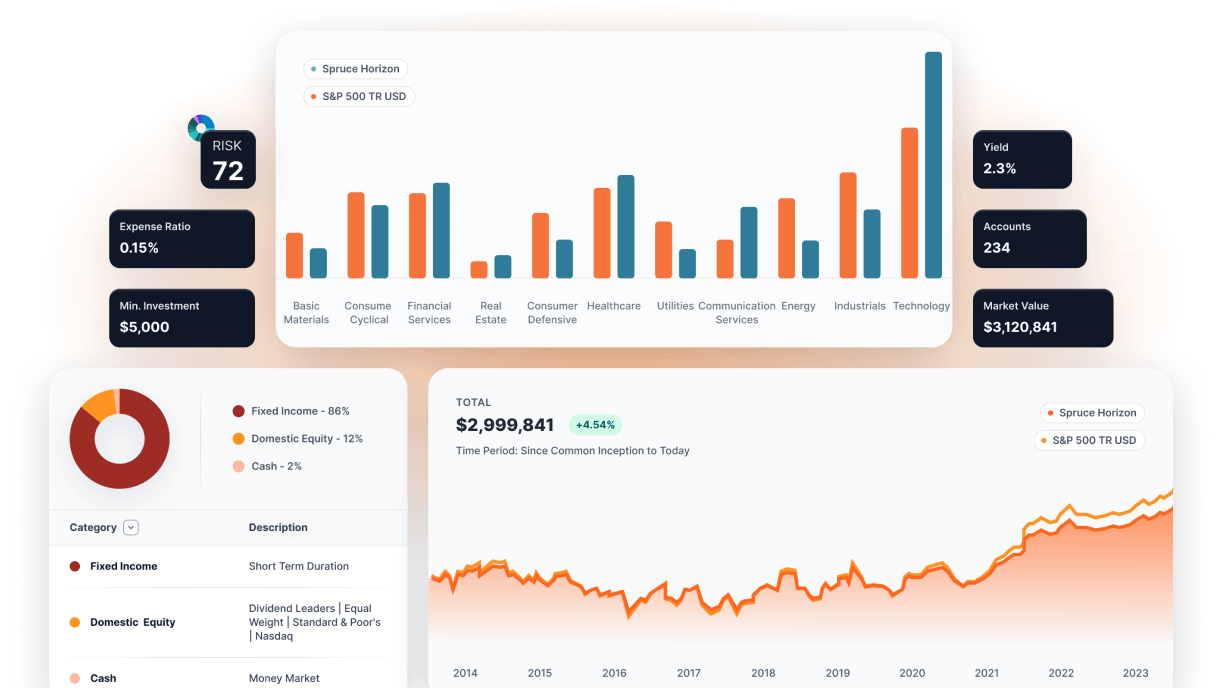
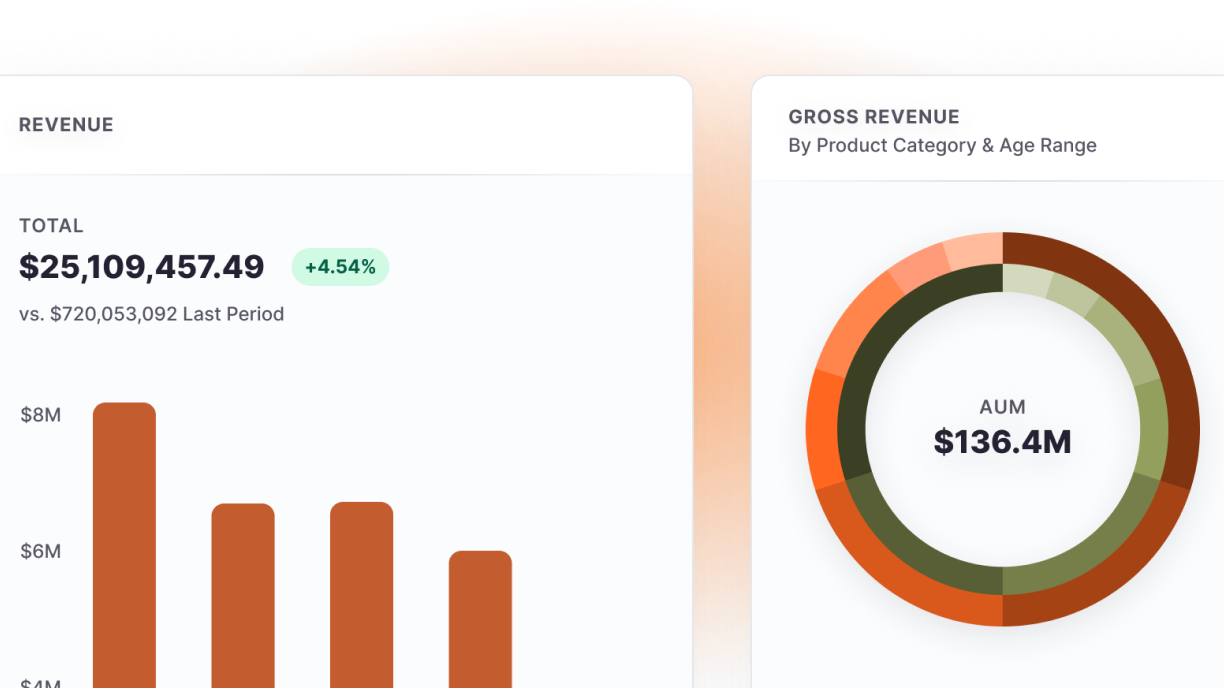
Real-Time Financial Clarity
Revenue, EBITDA, margins, and growth metrics that update automatically. No more scrambling to answer basic questions.

Operational Transparency
Predict which relationships are at risk before they walk. Spot wallet share opportunities hiding in plain sight.
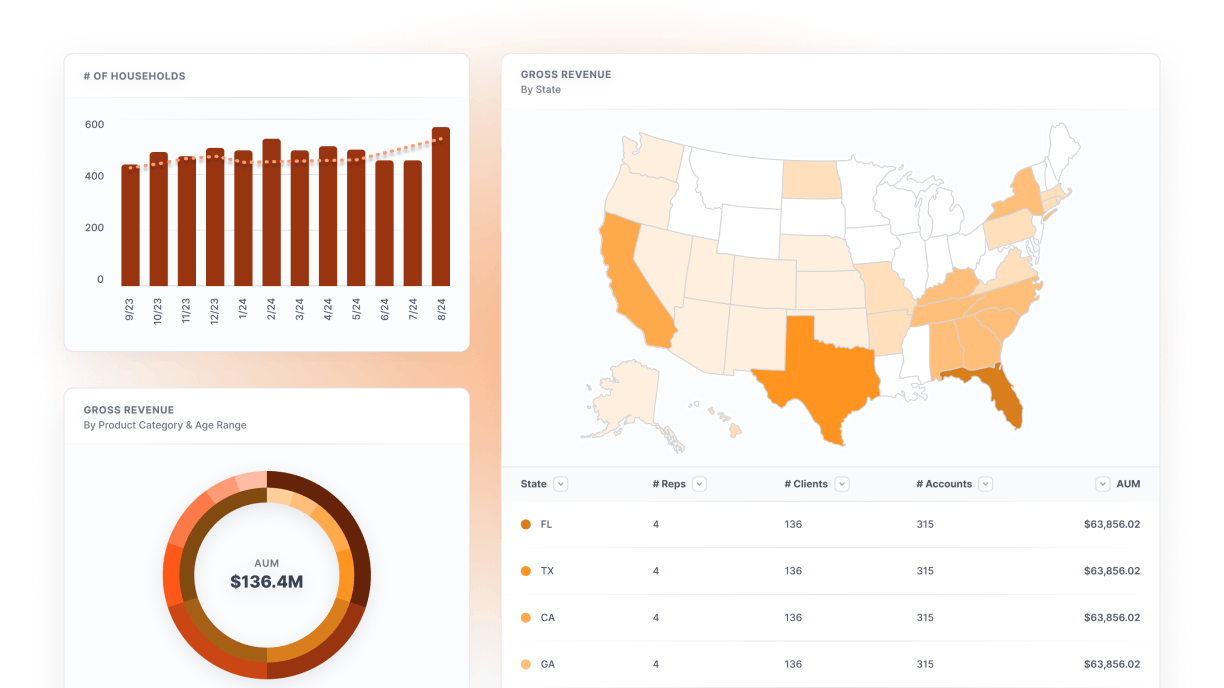
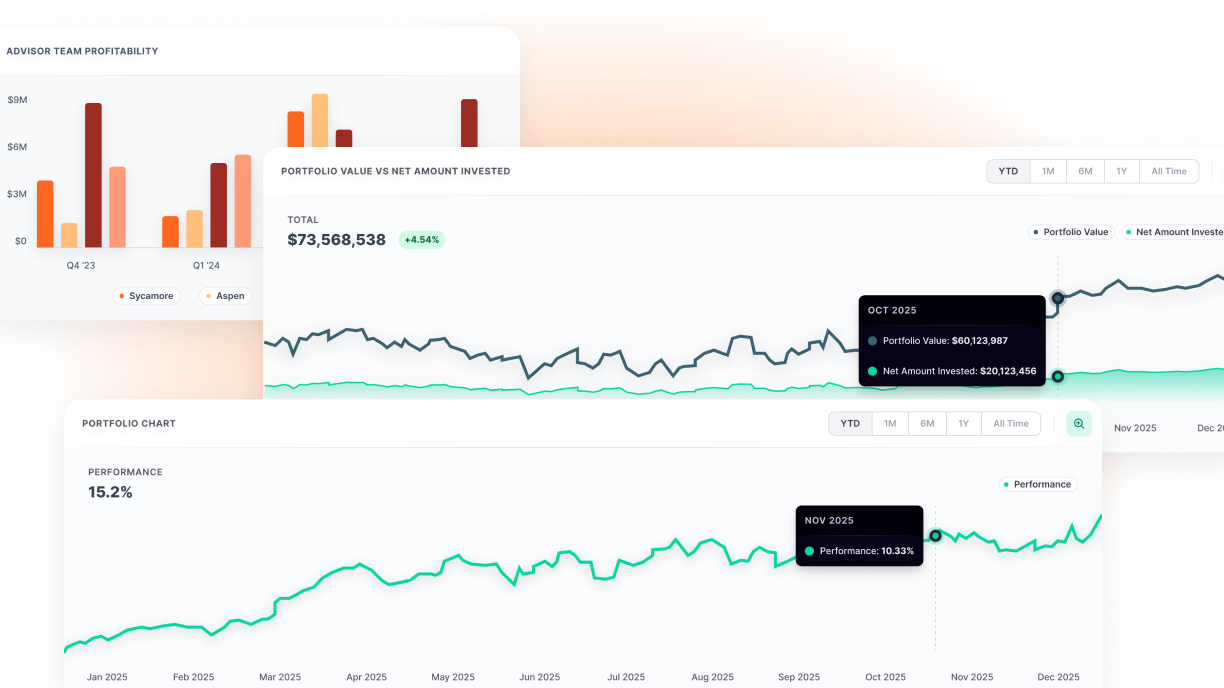
Growth Intelligence
Cohort analysis, unit economics, and predictive metrics that show not just where you’ve been, but where you’re going.

Due Diligence Ready
Professional data rooms, audit-trail documentation, and institutional-grade reporting that accelerates deal timelines.
What You Get
Financial Intelligence
-
Automated EBITDA calculations with transparent methodology
-
Margin analysis by business line & geographic region
-
Cost structure optimization & scalability modeling
-
Revenue predictability & recurring income analysis
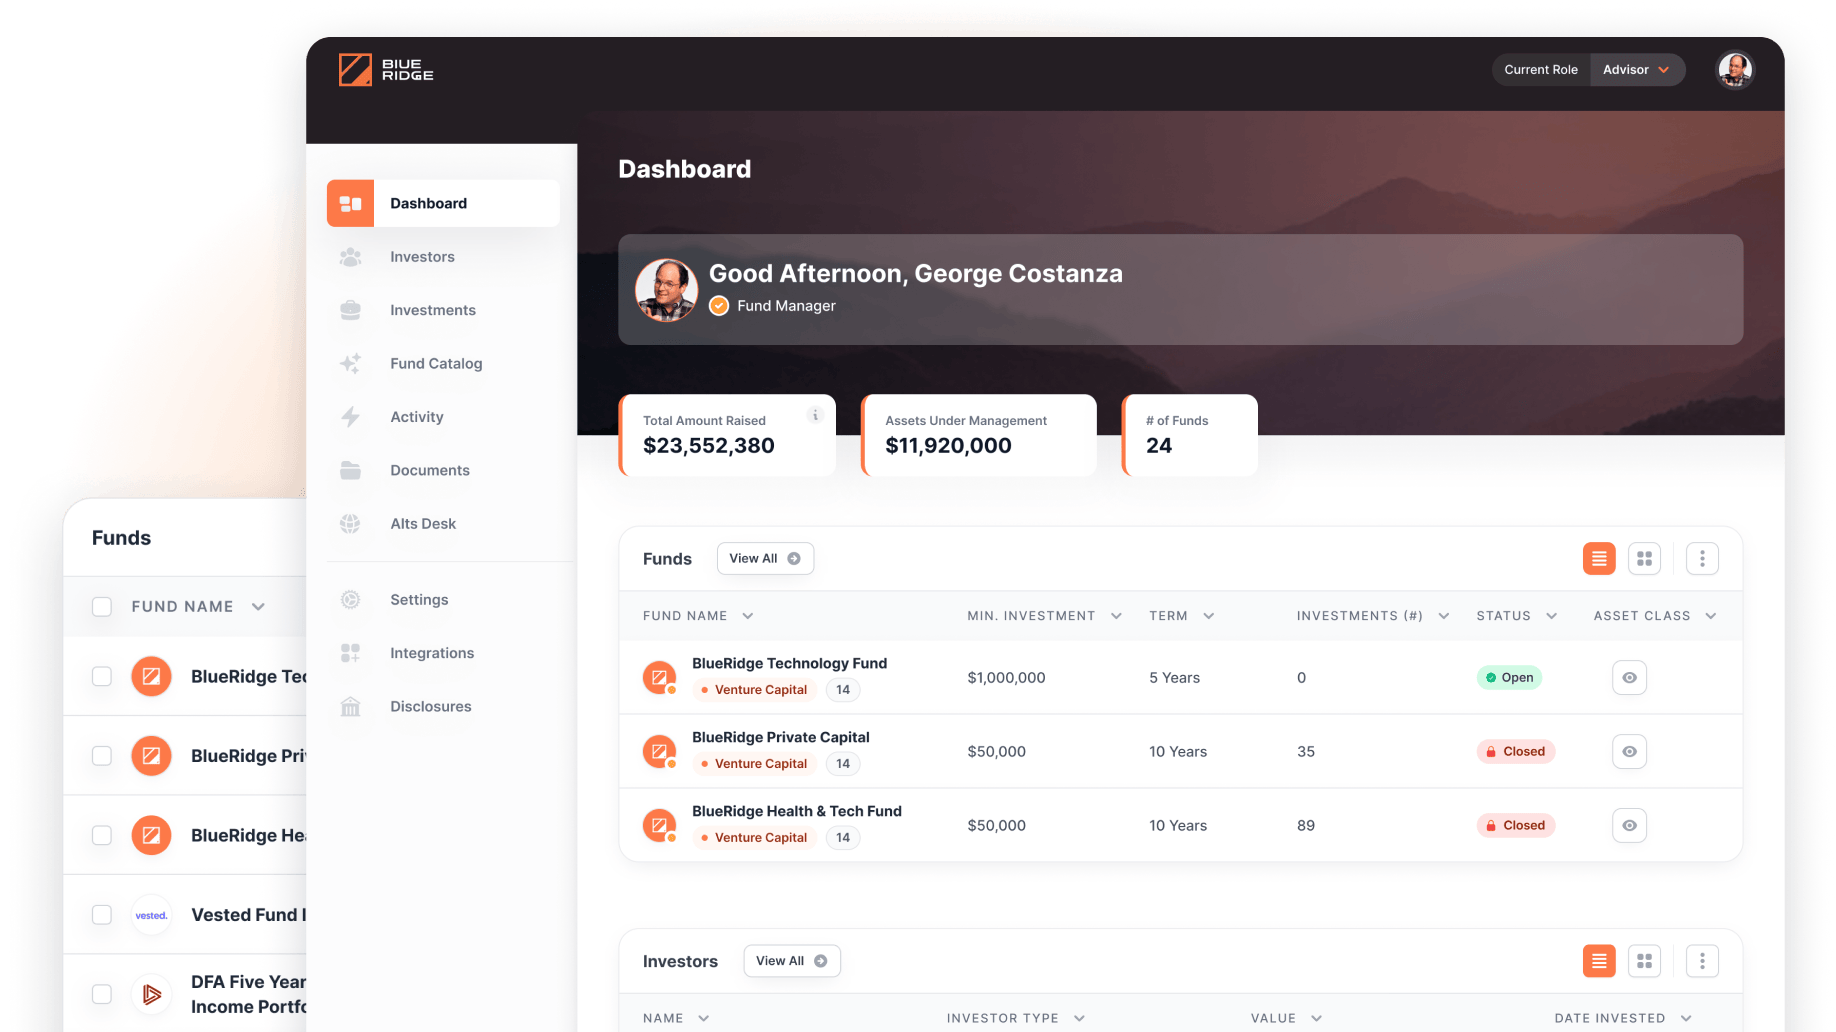
Investor Dashboard
-
Real-time firm valuation metrics & key performance indicators
-
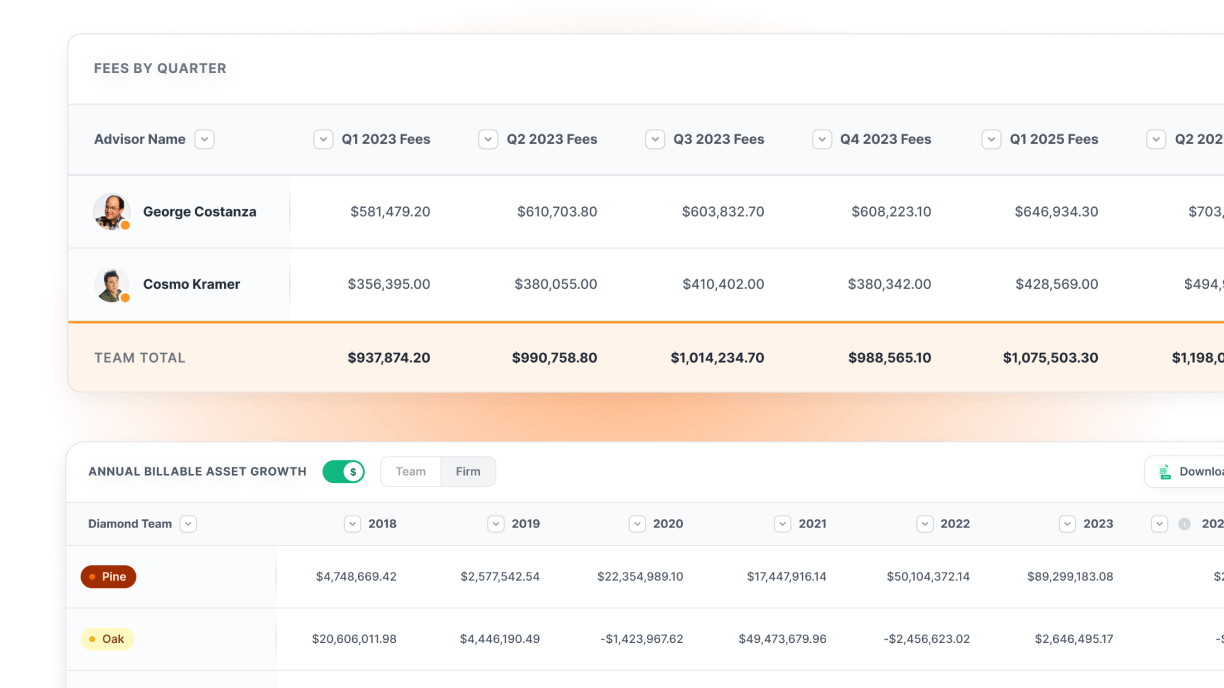
Revenue trends by advisor, office, & service line with growth trajectories
-
Client acquisition costs, lifetime value, & retention analytics
-
Operational efficiency metrics that prove scalability
Growth Analytics
-
Advisor productivity trends & capacity modeling
-
Market penetration analysis & expansion opportunities
-
Client wallet share progression & revenue expansion metrics
-
Acquisition integration success rates & synergy realization

Due Diligence Package
-
Automated financial reporting with institutional-grade accuracy
-
Complete operational documentation & process mapping
-
Historical performance analysis with forward-looking projections
-
Competitive positioning analysis based on comprehensive data
Operational Metrics
-
Technology ROI & automation effectiveness measurement
-
Process efficiency benchmarking & improvement tracking
-
Compliance monitoring with exception management analytics
-
Resource allocation optimization across all business functions
The Transformation
- Before Capital Readiness
-
Investor inquiries = weeks of data preparation panic
-
Due diligence = manual document compilation & spreadsheet reconciliation
-
Growth story = backward-looking metrics & hopeful projections
-
Valuation discussions = defensiveness about data quality
- After Capital Readiness

Investor inquiries

professional data room ready in hours

Due diligence
automated documentation & transparent analytics

Growth story
predictive intelligence & proven scalability

Valuation discussions
confidence backed by institutional-grade data
Real Results
Finally, someone is leveling up the data experience for advisors. What Milemarker™ is doing has been long overdue in the wealth management industry.

Torie Happe
Holistiplan Head of Partnerships

75%
reduction in due diligence preparation time

Real-time
investor reporting with institutional-grade accuracy

Predictive
analytics that support premium valuations

Operational
transparency that accelerates deal timelines
Capital
Readiness Features

Valuation Intelligence
-
Real-time firm valuation tracking with methodology transparency
-
Operational & financial metrics integrated into valuation models
-
Benchmark comparisons against industry standards & peer groups
-
Scenario modeling for different growth & market conditions
Growth Modeling
-
Advisor capacity analysis & expansion planning
-
Market opportunity sizing with data-driven assumptions
-
Revenue predictability scoring based on client & operational metrics
-
Acquisition integration modeling with historical success rates

Risk Assessment
-
Client concentration analysis & diversification metrics
-
Revenue stability measurement & recurring income tracking
-
Operational risk identification with mitigation documentation
-
Compliance monitoring with comprehensive exception management

Investor Relations
-
Automated board reporting with customizable metrics & insights
-
Real-time performance dashboards accessible to investor stakeholders
-
Quarterly business reviews with predictive analytics & trend analysis
-
Strategic planning support with data-driven scenario modeling
Built For
Institutional Standards

Audit-Grade Documentation
Every calculation, methodology, & data source fully documented for investor & auditor review.

Regulatory Compliance
SOC 2 Type II compliance & enterprise security standards that meet institutional investor requirements.
Scalability
Proof
Systems & processes that demonstrate ability to handle 10x growth without operational breakdown.


Transparency First
Complete visibility into operations, finances, & growth drivers that builds investor confidence.
Advanced
Capital Features
Strategic Intelligence
-
Market opportunity analysis based on current performance data
-
Competitive advantage identification & sustainable differentiation analysis
-
Acquisition target identification with integration success modeling
-
Strategic partnership evaluation & value creation assessment
Financial Performance Analytics
-
Margin analysis by business line, geography, & client segment
-
Cost structure optimization with scalability considerations
-
Working capital management & cash flow predictability analysis
-
Profitability trending with leading indicator identification
Predictive Intelligence
-
Revenue forecasting with confidence intervals based on historical performance
-
Client lifetime value modeling with retention & expansion analytics
-
Market share analysis & competitive positioning assessment
-
Growth scenario planning with resource requirement modeling
Operational Excellence Metrics
-
Process automation ROI & efficiency improvement tracking
-
Technology investment analysis & strategic infrastructure planning
-
Resource optimization across all business functions & geographies
-
Scalability assessment with bottleneck identification & resolution planning
Ready to Attract Capital?

Stop scrambling when opportunity calls

Stop defending your data quality instead of showcasing your growth potential.

Stop letting operational questions overshadow your strategic vision.
Why This Matters for Capital
Capital flows to businesses that can prove they’ll use it effectively. Investors back operations that can scale.