Your Business Has Stories to Tell.

Let Your Data Speak: Reveal Growth, Churn & Performance Gaps

Revenue trends that reveal growth opportunities. Client patterns that predict churn. Advisor productivity gaps that cost millions. Your data knows what’s working and what’s not.

Stop guessing. Start knowing.

Investment management dashboard showcasing various financial metrics, including assets under management, allocation summaries, and investment statuses, reflecting Milemarker™ Solutions' unified investment platform.

You're Flying a $2B Plane with a Paper Map

Board meeting. Tuesday. 2pm.

“Which advisors are actually growing their books?” Export from CRM. Build pivot table. Cross fingers.

“What’s driving our margin compression?” Text your CFO. Wait for spreadsheet. Hope it’s accurate.

“Are we losing clients we should be keeping?” Three-day analysis project. Results that are already outdated.

You built a sophisticated business. Your intelligence shouldn't be Stone Age.

Your Business Intelligence Lives in Data Jail

Growth Signals

Which advisors are expanding wallets vs. just collecting assets? Your CRM knows, but can’t tell you.

Risk Indicators
Client engagement dropping? Service gaps widening? Red flags scattered across systems you don’t connect.
Opportunity Blind Spots
Underserviced client segments. Revenue expansion possibilities. Competitive vulnerabilities hiding in plain sight.
Operational Inefficiencies
Processes that worked at $500M breaking at $2B. Bottlenecks that cost you millions in opportunity.
The insights that could transform your business are trapped in operational chaos.

Transform Data Noise Into Business Intelligence

Milemarker™ logo featuring interconnected squares symbolizing unified investment solutions and seamless integration across diverse platforms.

Growth Intelligence

See which advisors drive real expansion vs. just AUM gathering. Identify the strategies that actually work and scale them firm-wide.
Bar chart icon representing distribution analytics and data-driven insights for asset managers.

Client Intelligence

Predict which relationships are at risk before they walk. Spot wallet share opportunities hiding in plain sight.
Group of users icon representing collaboration and partnership in enterprise data solutions for CTOs.

Operational Intelligence

Find the bottlenecks killing your efficiency. Measure the ROI of every process and system investment.

Line chart illustrating revenue reporting automation, emphasizing streamlined processes and improved accuracy for financial firms.

Strategic Intelligence

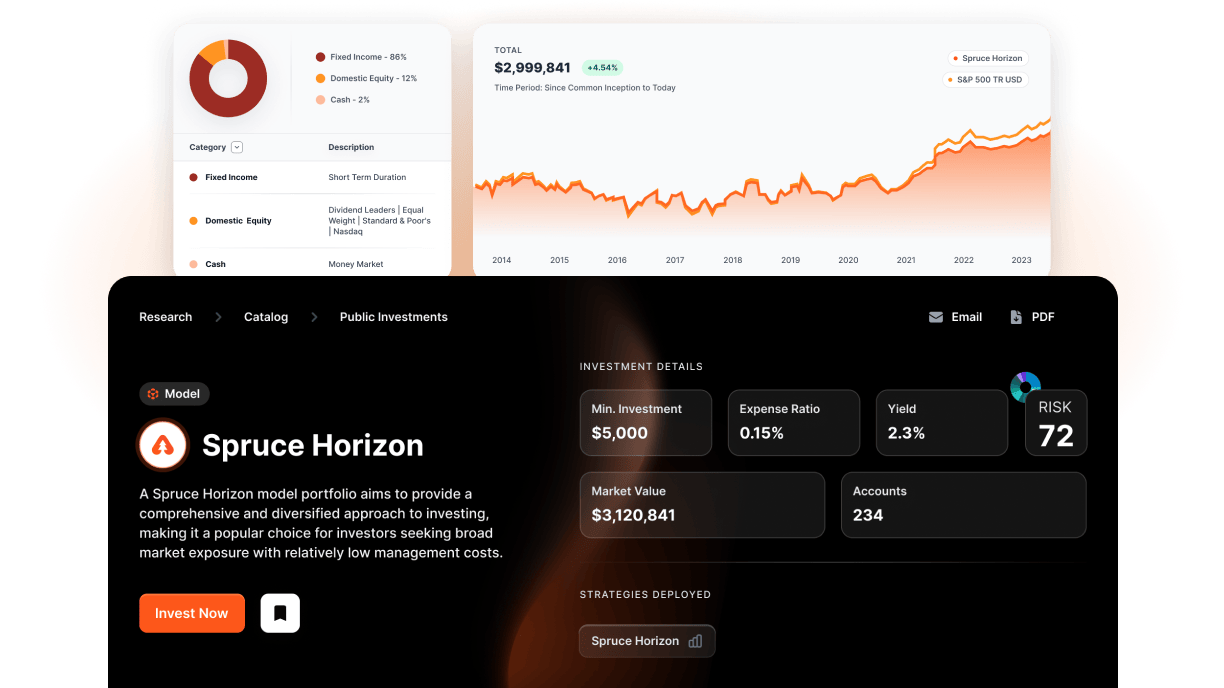
Understand which services make money, which markets offer opportunity, and where your competition is vulnerable.
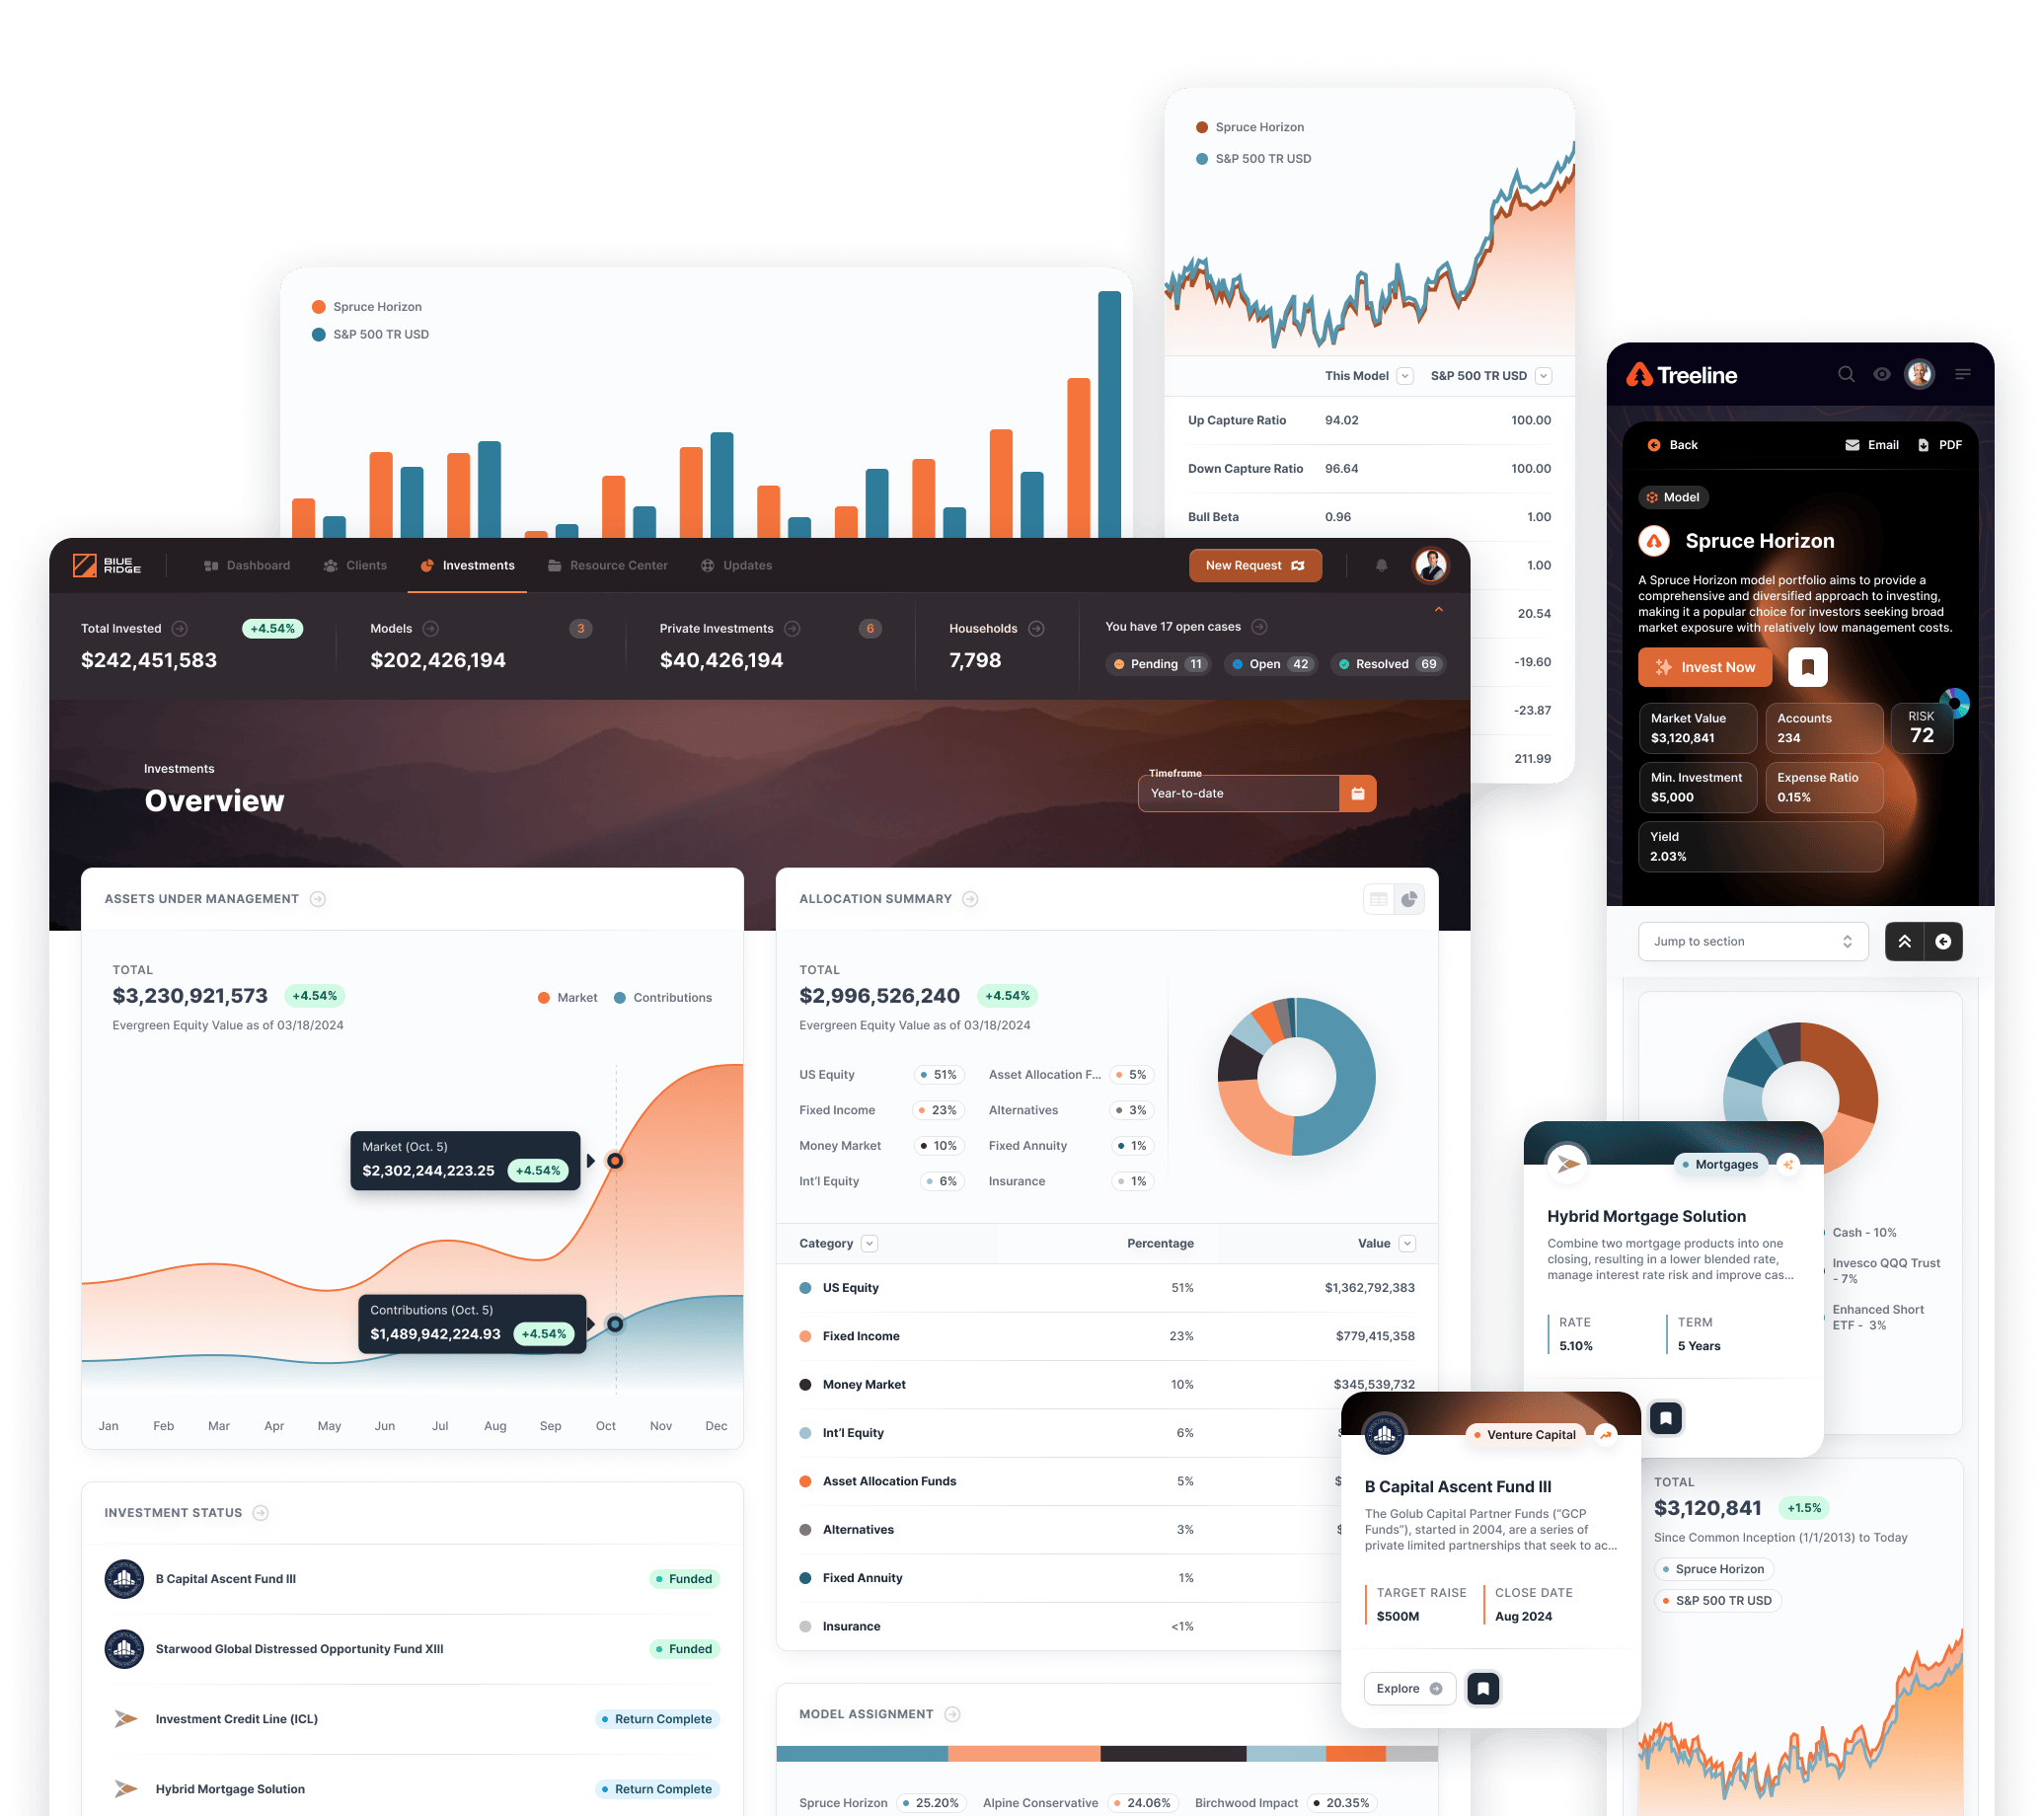
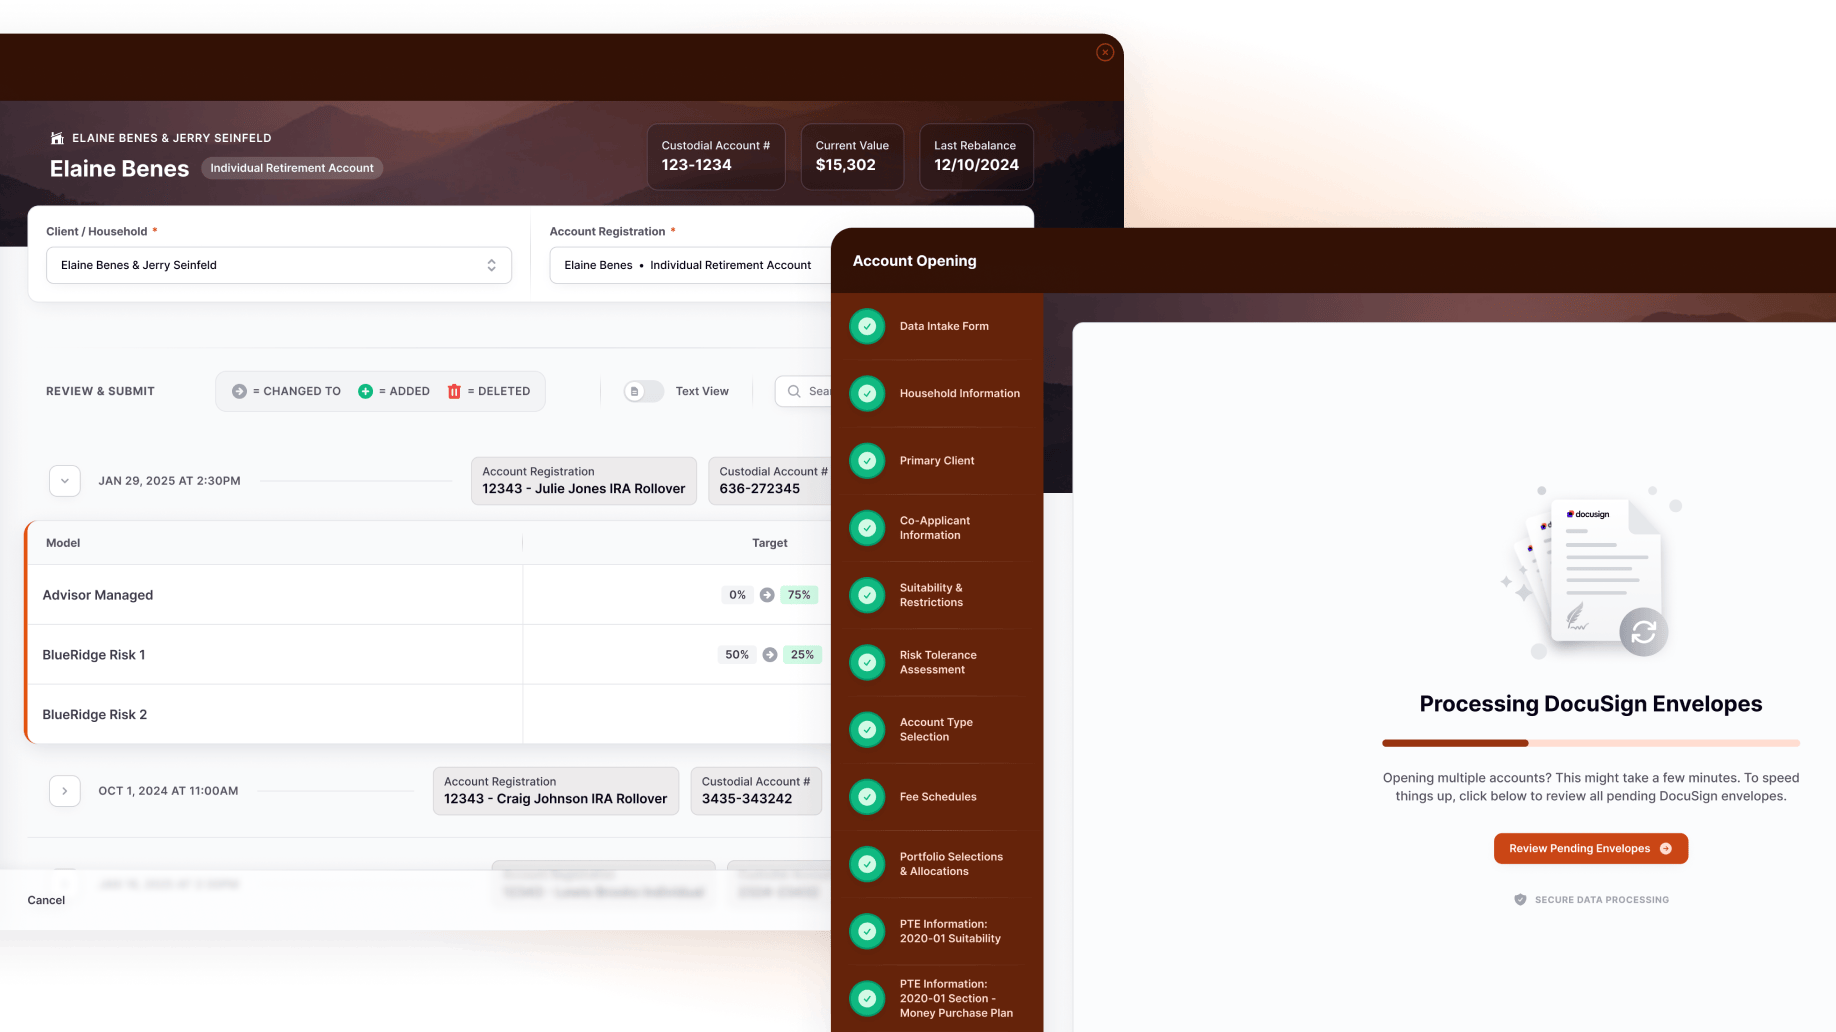
What You Get

Investment management solutions overview featuring various financial service categories such as Insurance, 401(k), Public Investments, Alternatives, Lending, Practice Management, and Lifestyle, with metrics indicating user engagement.

Executive Analytics Dashboard

  • Real-time business metrics across all systems

  • Revenue trends by advisor, office, and service line

  • Client acquisition costs and lifetime value analysis

  • Operational efficiency metrics and benchmarking

Model integration dashboard displaying various investment strategies, including Alpine Core SMA, Alps Tactical, and Andes Growth, with account details and market values, emphasizing portfolio management and analytics for financial advisors.

Advisor Intelligence

  • Productivity analytics that show who's really growing

  • Book composition analysis and wallet share opportunities

  • Client engagement scoring and retention predictions

  • Compensation alignment with actual performance drivers

Spruce Horizon model portfolio interface showcasing investment details, including minimum investment, expense ratio, market value, and risk rating, reflecting advisor-centric design and integrated analytics features.

Client Portfolio Analytics

  • Household profitability and service cost analysis

  • Engagement patterns that predict retention risk

  • Referral network mapping and opportunity identification

  • Service utilization patterns and expansion possibilities

Investment management solutions overview featuring various financial service categories such as Insurance, 401(k), Public Investments, Alternatives, Lending, Practice Management, and Lifestyle, with metrics indicating user engagement.

Operational Insights

  • Process efficiency measurement and bottleneck identification

  • Technology ROI analysis and optimization opportunities

  • Resource allocation effectiveness across teams and offices

  • Scalability assessment for growth planning

Model integration dashboard displaying various investment strategies, including Alpine Core SMA, Alps Tactical, and Andes Growth, with account details and market values, emphasizing portfolio management and analytics for financial advisors.

Strategic Market Intelligence

  • Competitive positioning analysis based on your data

  • Service line profitability and growth potential

  • Market penetration opportunities by geography and demographic

  • Acquisition target identification and integration planning

The Transformation

  • Strategic decisions = gut feelings + spreadsheets

  • Board questions = "let me get back to you"

  • Growth planning = extrapolation + hope

  • Performance management = lagging indicators

Cursor arrow with radiating rays, symbolizing streamlined data entry and automation in account opening processes for Milemarker™ platform.

Strategic decisions

Orange circular icon featuring two horizontal white equal signs, representing balance and accuracy in revenue reporting for financial firms.

data-driven confidence

Eye icon representing visibility and awareness in client data management and account opening processes.

Board questions

Orange circular icon featuring two horizontal white equal signs, representing balance and accuracy in revenue reporting for financial firms.

real-time answers

Icon of a lightning bolt symbolizing efficiency and automation in integrated workflows for Milemarker™ Platform.

Growth planning

Orange circular icon featuring two horizontal white equal signs, representing balance and accuracy in revenue reporting for financial firms.

predictive insights + opportunity mapping

Performance management

Orange circular icon featuring two horizontal white equal signs, representing balance and accuracy in revenue reporting for financial firms.

leading indicators + proactive optimization

Real Results

Milemarker™ was able to automate all of the data we used to meausure our success and give us a scalable platform we can build upon.

Picture of Pete Marshall

Pete Marshall

Founder and Managing Partner, Marshall Financial

Yellow clock icon representing efficiency in account opening processes, emphasizing speed and reduced manual data entry for Milemarker™ platform.

Complete

visibility into business performance drivers
Investment management platform icon representing scalability and customization for TAMPs and OCIOs.

Data-driven

strategic planning and resource allocation
Bar chart illustrating revenue accuracy improvements and reduced payout disputes, highlighting Milemarker™'s impact on financial firms' reporting efficiency and transparency.

Predictive

insights that prevent problems before they occur
Yellow television icon representing digital services and automated workflows for enhanced client experience and service delivery efficiency.

Competitive

intelligence that guides market positioning

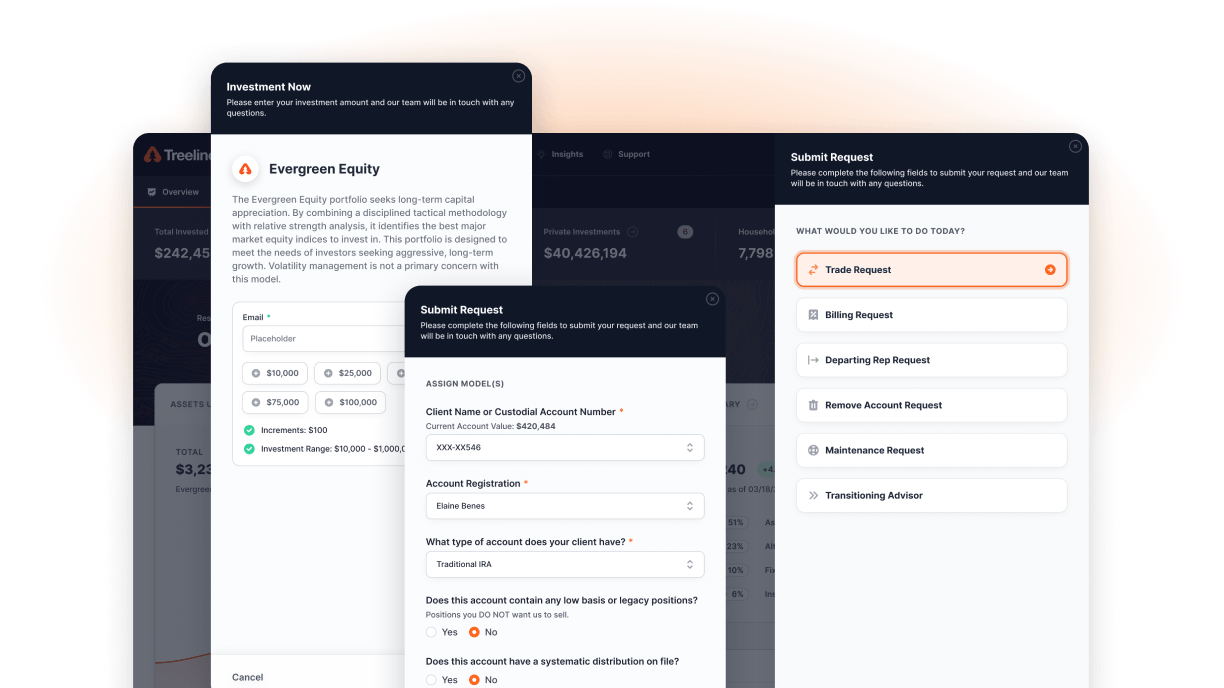
Intelligence That Drives Action

Client account management interface displaying account details and processing DocuSign envelopes for financial advisory services.

Revenue Optimization

  • Identify which advisors and strategies actually drive profitable growth

  • Spot underperforming segments and optimization opportunities

  • Measure the true ROI of marketing and business development investments

  • Optimize pricing and service delivery for maximum profitability

Graph displaying investment performance metrics, including total value of $2,999,841, with a line chart showing growth over time, investment categories like Fixed Income and Domestic Equity, and key details for the Spruce Horizon model portfolio, emphasizing investment strategies and risk assessment.

Risk Management

  • Early warning systems for client retention issues

  • Operational risk identification before it impacts performance

  • Compliance monitoring with predictive exception management

  • Financial risk assessment across all business lines

Graph displaying investment performance metrics, including total value of $2,999,841, with a line chart showing growth over time, investment categories like Fixed Income and Domestic Equity, and key details for the Spruce Horizon model portfolio, emphasizing investment strategies and risk assessment.

Growth Strategy

  • Market opportunity analysis based on your actual performance data

  • Advisor productivity benchmarking and development planning

  • Service expansion opportunities with quantified potential

  • Acquisition target identification with data-driven due diligence

Document management interface showcasing file options including Spruce Horizon documents in various formats, emphasizing user-friendly media organization for the Milemarker™ Platform.

Operational Excellence

  • Process optimization with measurable efficiency improvements

  • Technology investment ROI analysis and planning

  • Resource allocation optimization across teams and functions

  • Scalability planning for sustainable growth

Built For

Leadership Intelligence

User icon representing personalized advisor experiences in the Milemarker™ Platform for financial advisors.
Real-Time Dashboards
Your business metrics update automatically as transactions happen. Always current, always accurate.
Globe icon representing global investment management integration for financial advisors in the Milemarker™ Investment Center platform.
Predictive Analytics
Identify trends before they become problems. See opportunities before your competition does.
Drill-Down Capability
Built-in approval workflows, suitability checks, and regulatory documentation for all investment types.
Scale icon representing performance monitoring and workflow management for Milemarker™ Platform.
Simplified revenue reporting and data management solutions for financial firms, featuring unified portfolio integration and automation tools.
Mobile Intelligence
Access your business insights anywhere. Make informed decisions whether you’re in the office or at 30,000 feet.

Advanced Analytics Features

Investment management interface showcasing Evergreen Equity portfolio details, user input fields for trade requests, and options for account management, emphasizing unified workflows and seamless integration.

Cohort Analysis

  • Track client and advisor performance over time

  • Identify patterns that predict long-term success

  • Measure the impact of strategic initiatives

  • Compare different segments and strategies

Graph displaying investment performance metrics, including total value of $2,999,841, with a line chart showing growth over time, investment categories like Fixed Income and Domestic Equity, and key details for the Spruce Horizon model portfolio, emphasizing investment strategies and risk assessment.

Scenario Modeling

  • Test strategic decisions before implementing them

  • Model the impact of market changes on your business

  • Plan for growth scenarios with confidence

  • Optimize resource allocation for maximum impact

Graph displaying investment performance metrics, including total value of $2,999,841, with a line chart showing growth over time, investment categories like Fixed Income and Domestic Equity, and key details for the Spruce Horizon model portfolio, emphasizing investment strategies and risk assessment.

Competitive Intelligence

  • Benchmark your performance against industry standards

  • Identify competitive advantages and vulnerabilities

  • Track market share and positioning over time

  • Guide strategic positioning and differentiation

Document management interface showcasing file options including Spruce Horizon documents in various formats, emphasizing user-friendly media organization for the Milemarker™ Platform.

Predictive Insights

  • Client retention probability scoring

  • Revenue forecasting with confidence intervals

  • Advisor performance trend analysis

  • Market opportunity identification and sizing

Powered By:
Built With:
Enhanced by:
Milemarker logo in white, representing a financial advisory business focused on serving, specializing, and scaling for growth.

Ready to Truly Understand Your Business?

Watch real-time business analytics that reveal what’s really driving your success.
30 minutes to map the intelligence capabilities your business needs.
Bar chart illustrating workflow improvements and data accuracy in integrated processes for Milemarker™ Platform.

Stop managing by intuition.

User icon with plus sign, symbolizing data collaboration and integration in financial services data infrastructure solutions.

Stop making strategic decisions with incomplete information.

Puzzle piece icon representing integration solutions for centralized data architecture in wealth management.

Stop accepting "close enough" when your business demands precisio

Why This Matters

Every uninformed decision costs you opportunity. Every strategic guess risks your competitive position.
As a leader, your job is to see around corners and make decisions that position your firm for long-term success.
Understand your business with the intelligence it deserves.