
Business Intelligence for Wealth Management
Business Intelligence for Wealth Management
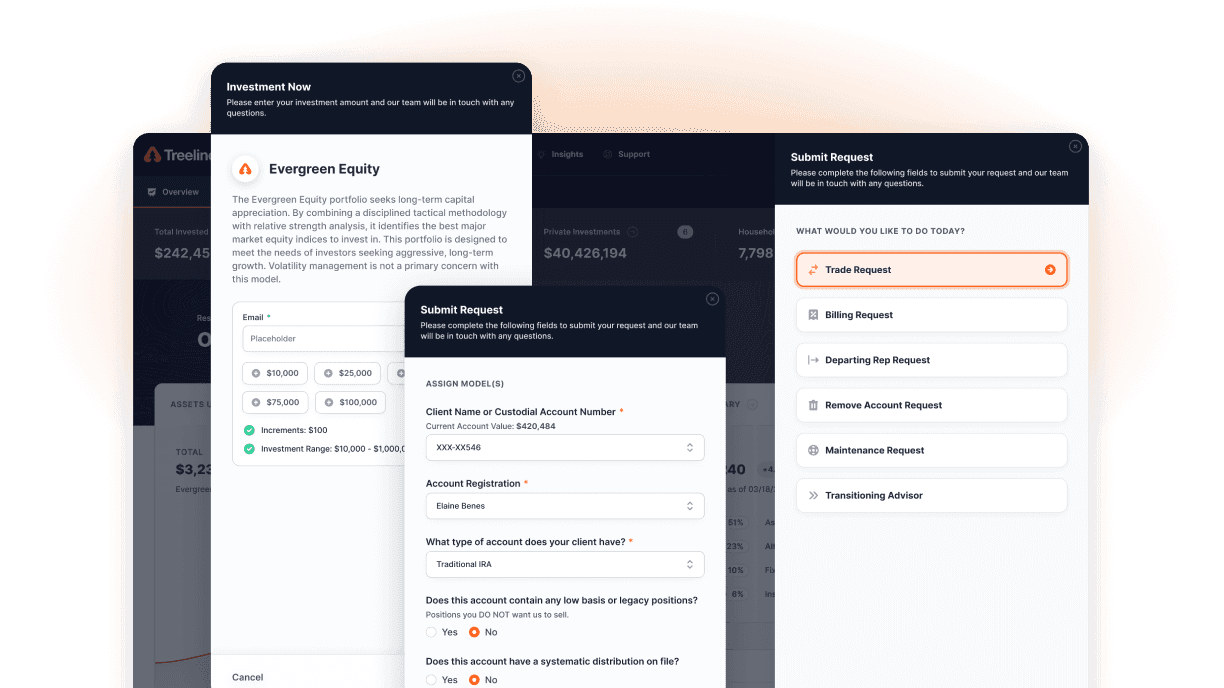
Real-Time Insights
Real-Time Insights
Real-time visibility into your firm's performance. No more waiting for reports.
Real-time visibility into your firm's performance. No more waiting for reports.
The Milemarker™ Data Engine makes your BI investment actually work.
The Milemarker™ Data Engine makes your BI investment actually work.


Great Tools. Terrible Data.
You invested in Power BI.
Built beautiful dashboards. Then spent months trying to connect your 12 different systems.
Your Tableau licenses are expensive.
But half your reports show “No Data Available” because the integration broke again.
Your team loves Sigma.
When they can actually get clean data into it, which happens maybe once a quarter.
The problem isn't your BI tool. It's your data infrastructure.
The Data Foundation
Powerful Results.

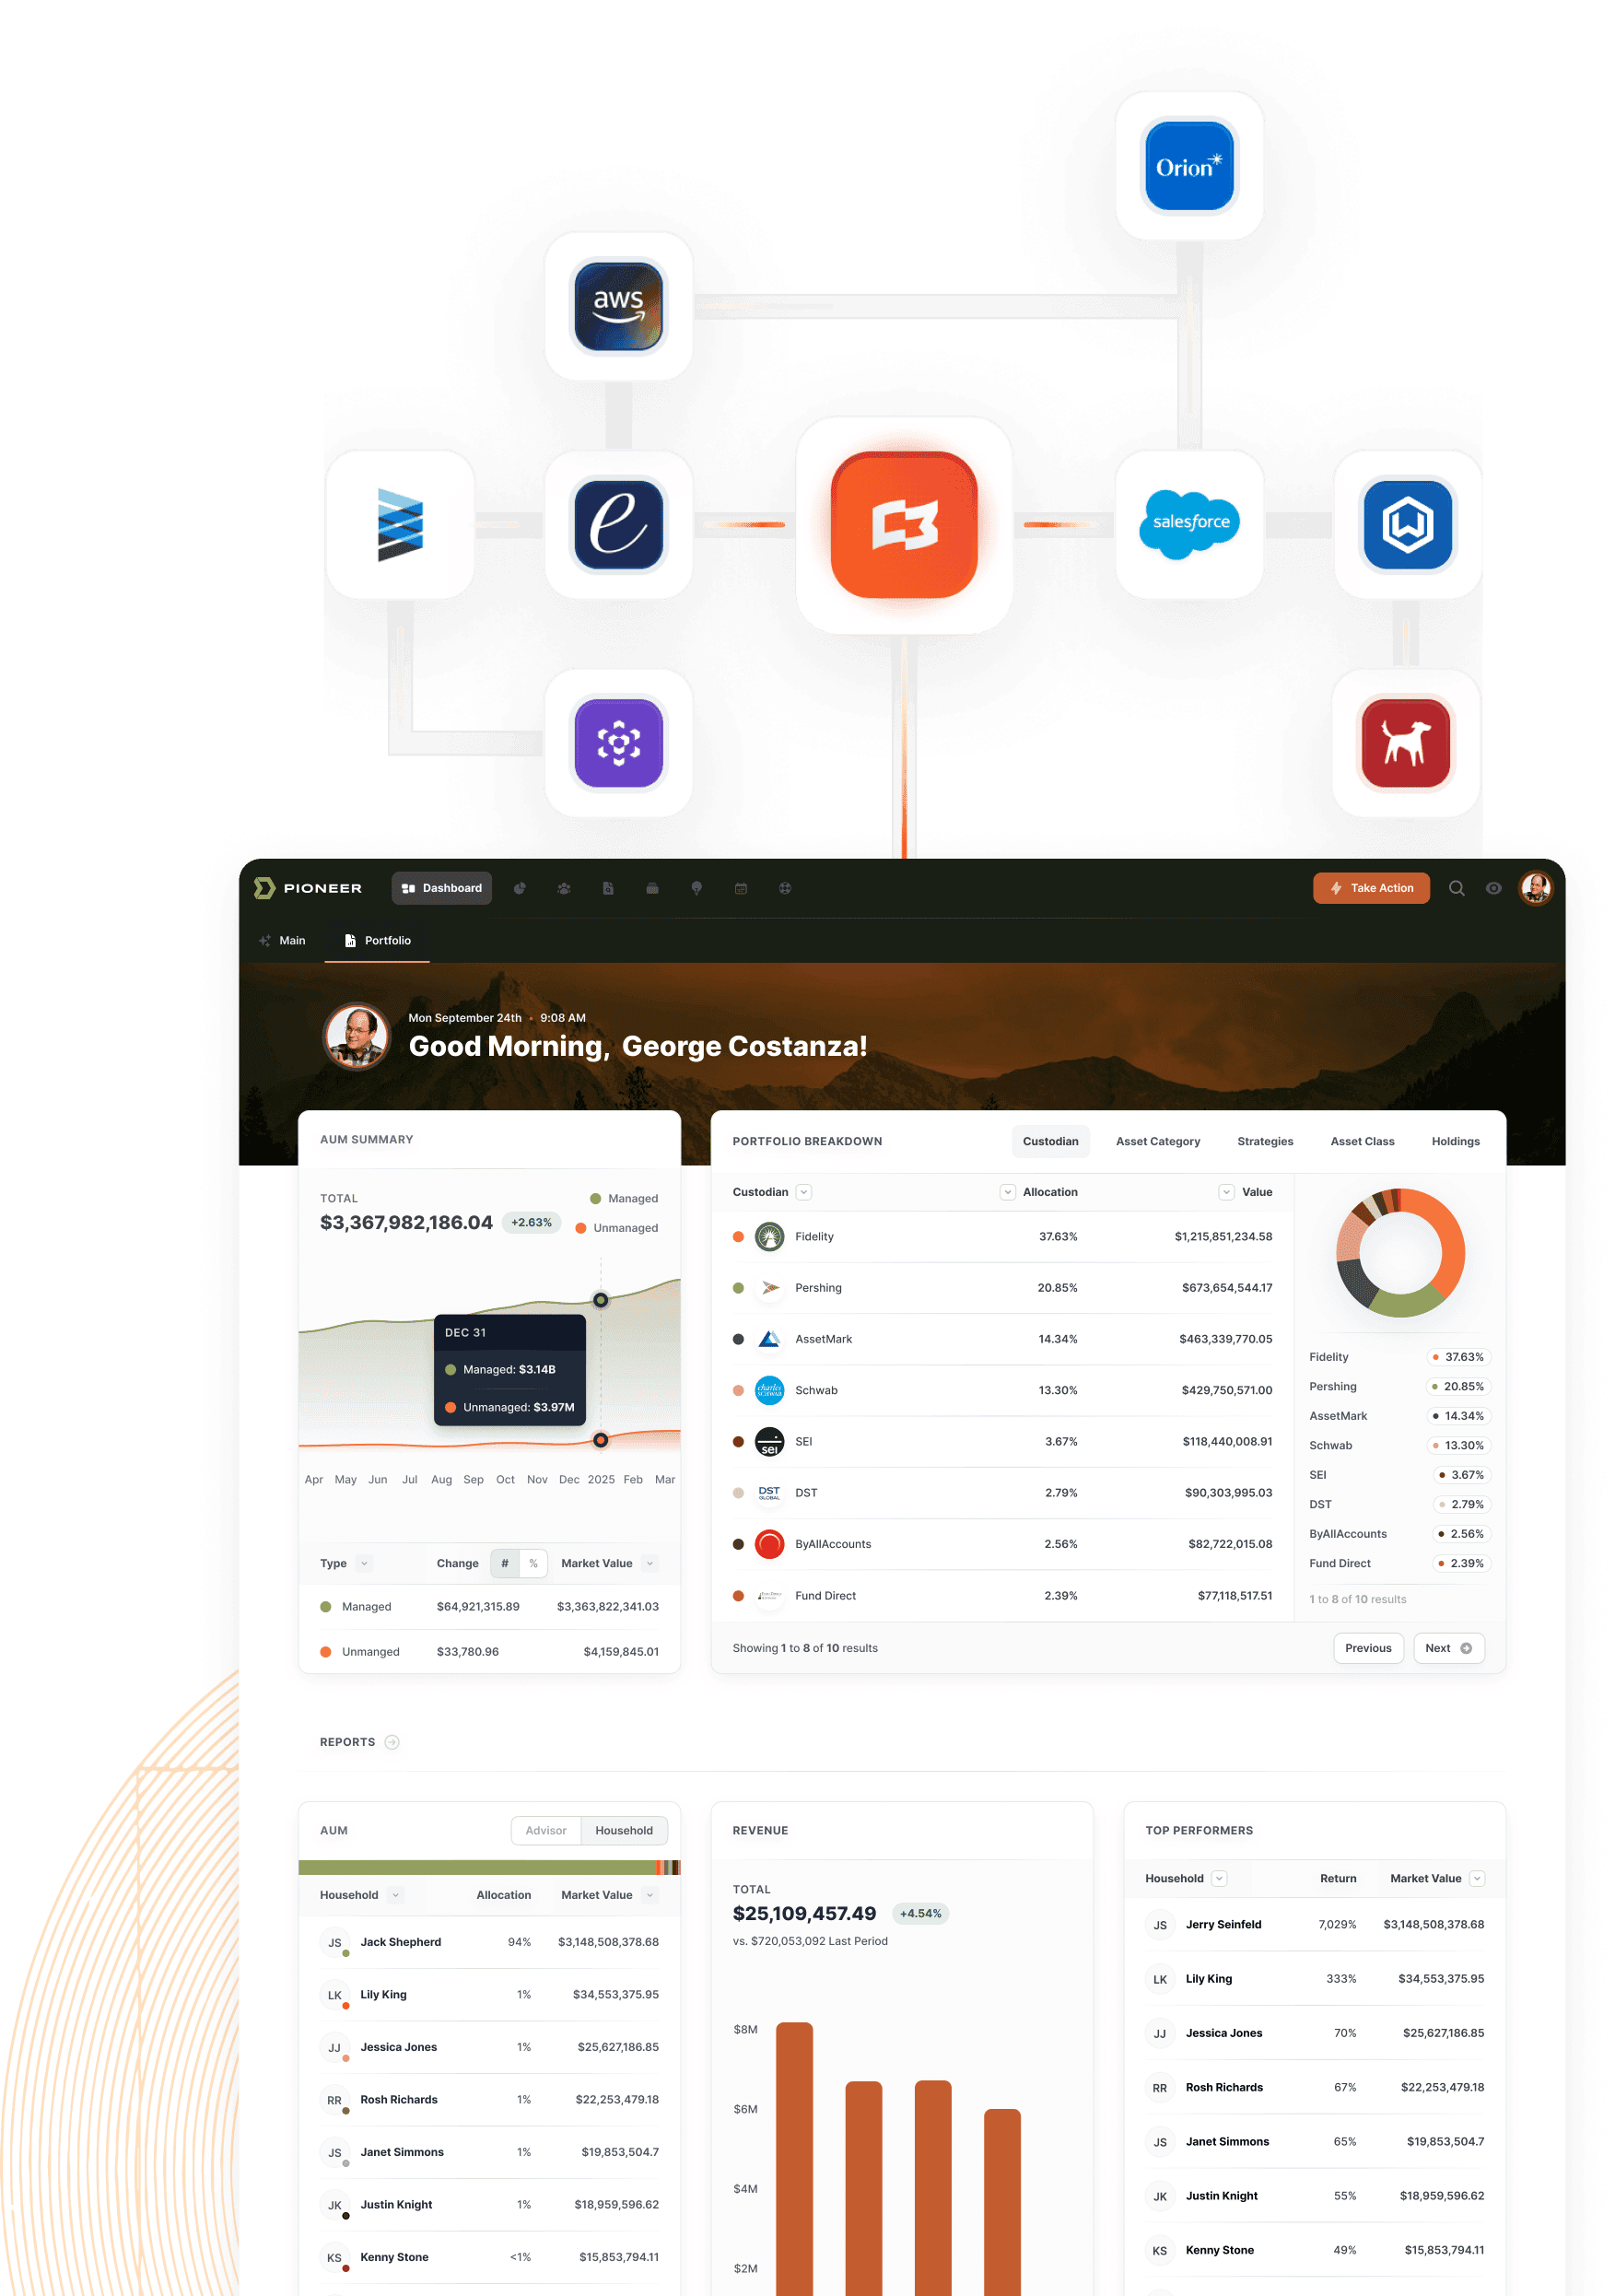
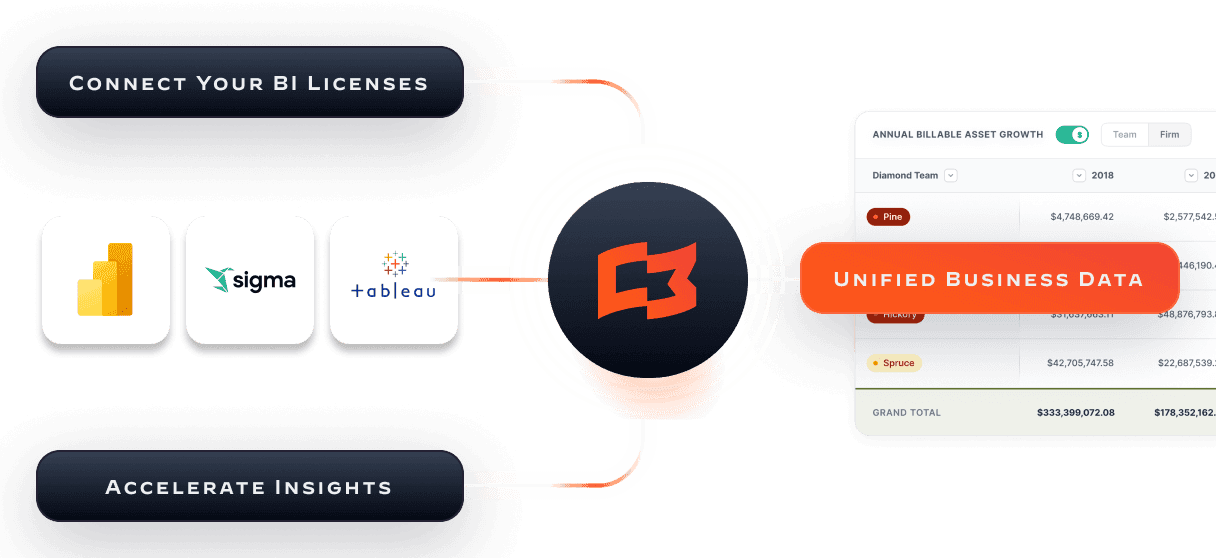
Unified Data Layer
All your wealth management data—CRM, custodians, portfolio systems, billing platforms—flowing into one secure, analytics-ready warehouse.

Native BI Connectivity
Direct connectors to Power BI, Tableau, Sigma, and other leading BI platforms. No custom development required.

Real-Time Updates
Your dashboards refresh automatically as data changes across your systems. No more stale reports or manual exports.

Clean, Normalized Data
Consistent field names, standardized formats, and reliable relationships. Your BI tools see data the way they’re designed to.
The Data Foundation
Powerful Results.
Unified Data Layer
All your wealth management data—CRM, custodians, portfolio systems, billing platforms—flowing into one secure, analytics-ready warehouse.
Native BI Connectivity
Direct connectors to Power BI, Tableau, Sigma, and other leading BI platforms. No custom development required.
Real-Time Updates
Your dashboards refresh automatically as data changes across your systems. No more stale reports or manual exports.
Clean, Normalized Data
Consistent field names, standardized formats, and reliable relationships. Your BI tools see data the way they’re designed to.

Supported BI Platforms

Microsoft Power BI
Microsoft Power BI

Native connector with automatic refresh
Direct query capabilities for real-time dashboards
Role-based access control integration
Custom visual support for wealth management metrics
Tableau
Tableau
Live connection to Snowflake data warehouse
Extract optimization for performance
Advanced analytics and forecasting support
Mobile dashboard compatibility
Sigma
Sigma
Cloud-native connectivity with instant sync
Collaborative analytics and sharing
SQL and no-code query options
Embedded analytics capabilities
Other Platforms
Any BI tool that connects to Snowflake or supports standard SQL databases can leverage the Milemarker™ Data Engine.

The Transformation
The Transformation
Cloud-native connectivity with instant sync
Collaborative analytics and sharing
SQL and no-code query options
Embedded analytics capabilities
Cloud-native connectivity with instant sync
Collaborative analytics and sharing
SQL and no-code query options
Embedded analytics capabilities


Building Reports

Drag & Drop From Unified Data

Dashboard Accuracy
Dashboard Accuracy
Confident, Validated Data

Real-Time Insights
Automatic Updates
automatic updates
BI Tool ROI
BI Tool ROI
Finally Maximized
REAL RESULTS
We’ve been able to automatically create reports that would have otherwise taken us weeks– including some that would have been nearly impossible to do. We’re in a new era of transparency and automation of data in our business.

Laura Hubbell
Chief Information Officer at SignatureFD
We’ve been able to automatically create reports that would have otherwise taken us weeks– including some that would have been nearly impossible to do. We’re in a new era of transparency and automation of data in our business.
Laura Hubbell
Chief Information Officer at SignatureFD
Key Capabilities

Data Preparation
Automatic normalization and cleansing
Consistent field mapping across all sources
Historical data preservation and time-series support
Custom calculations and derived metrics
Performance Optimization
Snowflake’s columnar storage for fast queries
Intelligent caching and query optimization
Elastic scaling for concurrent users
Pre-aggregated views for common reports

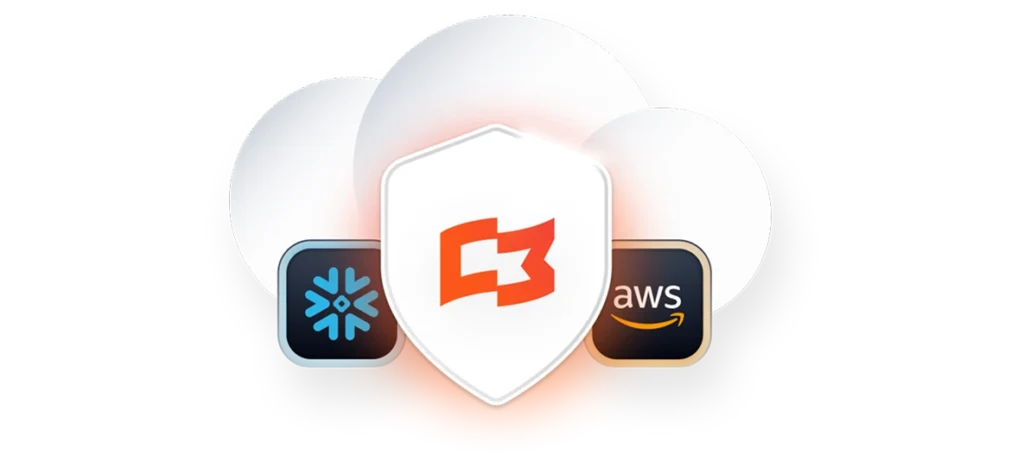
Governance & Security
Role-based data access controls
Audit trails for all data usage
SOC 2 compliant infrastructure
Row-level security for multi-tenant environments

Advanced Analytics Support
Time travel for historical analysis
Machine learning model integration
Real-time streaming data capabilities
Custom metric definitions and KPIs
Common Use Cases

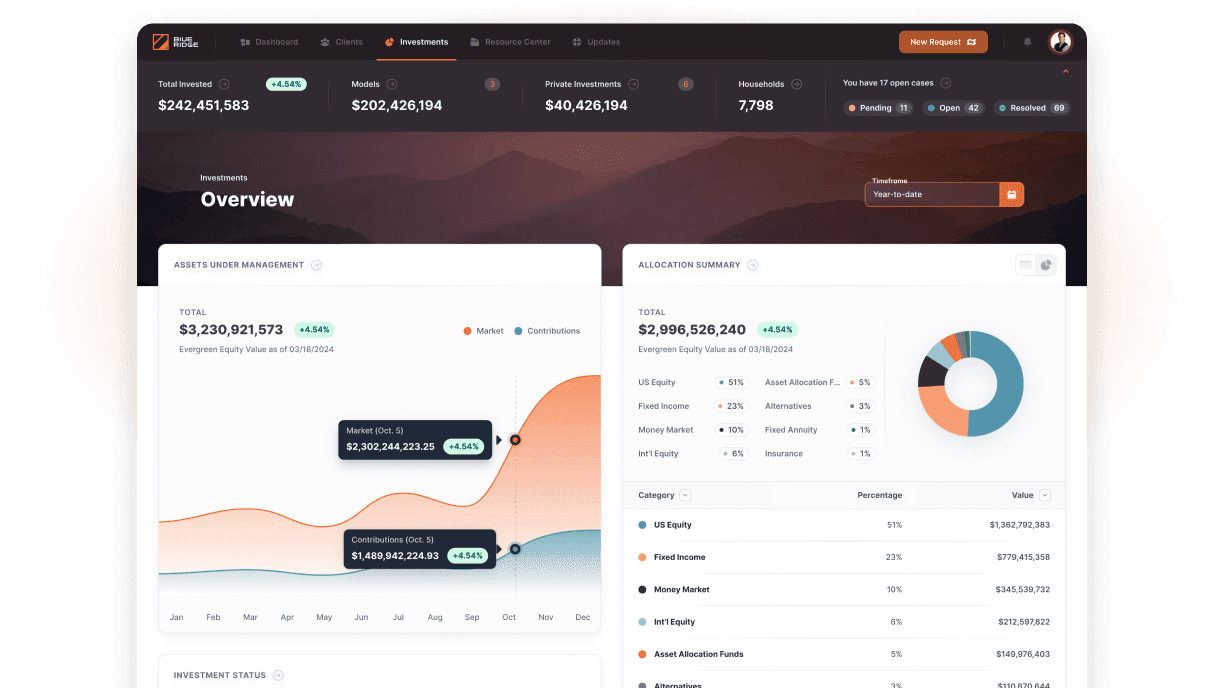
Executive Dashboards
Revenue trends, cost analysis, and profitability metrics with real-time updates from across your operation.
Executive Dashboards
Revenue trends, cost analysis, and profitability metrics with real-time updates from across your operation.
Advisor Performance Analytics
Book growth, client acquisition, and productivity benchmarking with automated data from CRM and portfolio systems.

Advisor Performance Analytics
Book growth, client acquisition, and productivity benchmarking with automated data from CRM and portfolio systems.
Financial Planning Analysis
Fee reconciliation, margin analysis, and forecasting powered by clean, connected financial data.

Financial Planning Analysis
Fee reconciliation, margin analysis, and forecasting powered by clean, connected financial data.
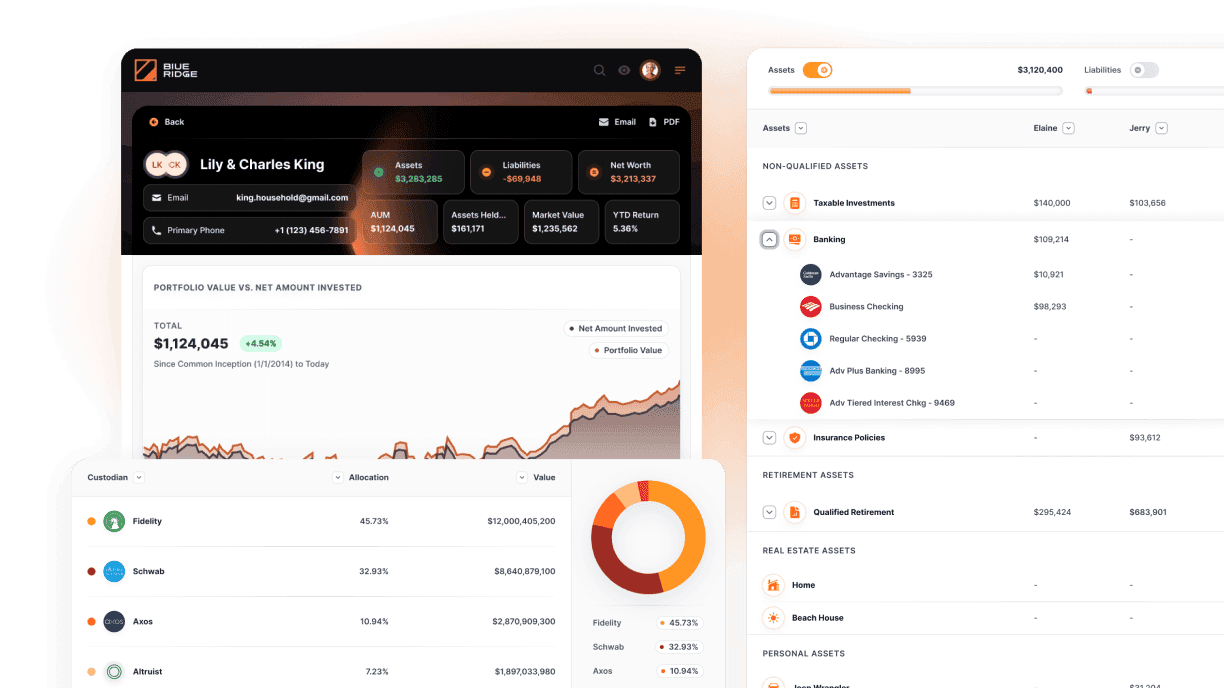
Client Intelligence
Household analysis, wallet share opportunities, and retention modeling using unified client data.
Client Intelligence
Household analysis, wallet share opportunities, and retention modeling using unified client data.
Operational Reporting
Workflow efficiency, compliance monitoring, and resource utilization across all business functions.
Operational Reporting
Workflow efficiency, compliance monitoring, and resource utilization across all business functions.
Common Use Cases
Executive Dashboards
Revenue trends, cost analysis, and profitability metrics with real-time updates from across your operation.
Advisor Performance Analytics
Book growth, client acquisition, and productivity benchmarking with automated data from CRM and portfolio systems.
Financial Planning Analysis
Fee reconciliation, margin analysis, and forecasting powered by clean, connected financial data.
Client Intelligence
Household analysis, wallet share opportunities, and retention modeling using unified client data.
Operational Reporting
Workflow efficiency, compliance monitoring, and resource utilization across all business functions.
Implementation Process
Implementation Process
Data Foundation
Connect your existing systems to the Milemarker Data Engine and establish unified data schemas.

Data Foundation
Connect your existing systems to the Milemarker Data Engine and establish unified data schemas.
Data Foundation
Connect your existing systems to the Milemarker Data Engine and establish unified data schemas.
Self-Service Access
Your team uses their existing BI skills and tools with clean, unified data—no additional training required.

Self-Service Access
Your team uses their existing BI skills and tools with clean, unified data—no additional training required.
Self-Service Access
Your team uses their existing BI skills and tools with clean, unified data—no additional training required.
Immediate Results
Start building better dashboards and reports right away using the BI platform you already know.
Immediate Results
Start building better dashboards and reports right away using the BI platform you already know.
Immediate Results
Start building better dashboards and reports right away using the BI platform you already know.
The BI Advantage

Maximize Your Investment
Get full value from your existing BI licenses by giving them the clean, connected data they need to shine.
Maximize Your Investment
Get full value from your existing BI licenses by giving them the clean, connected data they need to shine.
Maximize Your Investment
Get full value from your existing BI licenses by giving them the clean, connected data they need to shine.
Future-Proof Architecture
Built on industry-leading platforms that evolve with your needs and support emerging analytics trends.
Future-Proof Architecture
Built on industry-leading platforms that evolve with your needs and support emerging analytics trends.
Future-Proof Architecture
Built on industry-leading platforms that evolve with your needs and support emerging analytics trends.
Future-Proof Architecture
Built on industry-leading platforms that evolve with your needs and support emerging analytics trends.
Scale Analytics
Add new data sources, users, and dashboards without worrying about performance or data quality.
Accelerate Insights
Spend time analyzing your business instead of hunting for data or fixing broken connections.
Scale Analytics
Add new data sources, users, and dashboards without worrying about performance or data quality.
Accelerate Insights
Spend time analyzing your business instead of hunting for data or fixing broken connections.
Ready to Supercharge Your BI?
Stop fighting with data. Start getting insights.
Watch how your existing dashboards transform with unified data.

Free analysis of how Milemarker™ can optimize your current BI investment.
Ready to Supercharge Your BI?
Stop fighting with data. Start getting insights.
Watch how your existing dashboards transform with unified data.
Free analysis of how Milemarker™ can optimize your current BI investment.
Ready to Supercharge Your BI?
Stop fighting with data. Start getting insights.
Watch how your existing dashboards transform with unified data.
Free analysis of how Milemarker™ can optimize your current BI investment.


The Infrastructure for Wealth
Phone
+1 (470) 502-5600
Address
Milemarker Inc.
16192 Coastal Highway
Lewes, Delaware 19958
Built by Teams In:
Atlanta, Charleston, Cincinnati, Denver, Omaha & Portland.


Partners


Platform
Solutions
© 2026 Milemarker Inc. All rights reserved
DISCLAIMER: All product names, logos, and brands are property of their respective owners in the U.S. and other countries, and are used for identification purposes only. Use of these names, logos, and brands does not imply affiliation or endorsement.
Empowering Advisors
To Enjoy Every Mile.
Phone
+1 (470) 502-5600
Address
Milemarker Inc.
16192 Coastal Highway
Lewes, Delaware 19958
Built by Teams In:
Atlanta, Charleston, Cincinnati, Denver, Omaha & Portland.
Partners
Platform
Solutions
© 2026 Milemarker Inc. All rights reserved
DISCLAIMER: All product names, logos, and brands are property of their respective owners in the U.S. and other countries, and are used for identification purposes only. Use of these names, logos, and brands does not imply affiliation or endorsement.
The Infrastructure for Wealth
Phone
+1 (470) 502-5600
Address
Milemarker Inc.
16192 Coastal Highway
Lewes, Delaware 19958
Built by Teams In:
Atlanta, Charleston, Cincinnati, Denver, Omaha & Portland.
Partners