Every Month-End Is Groundhog Day
Board Meeting Tuesday. Need Revenue By Office.
Export from Schwab. Export from Fidelity. Pull data from Orion. Check Black Diamond. Download from billing system. None of the numbers match.
Advisors call:
"Why is my revenue different from last month's report?"
You think:
"Because I'm still figuring out which system is right."
Spend three days reconciling.
Find calculation errors. Fix what you can. Present approximations.
You're Not Reporting Revenue. You're Managing Confusion.


What You Get
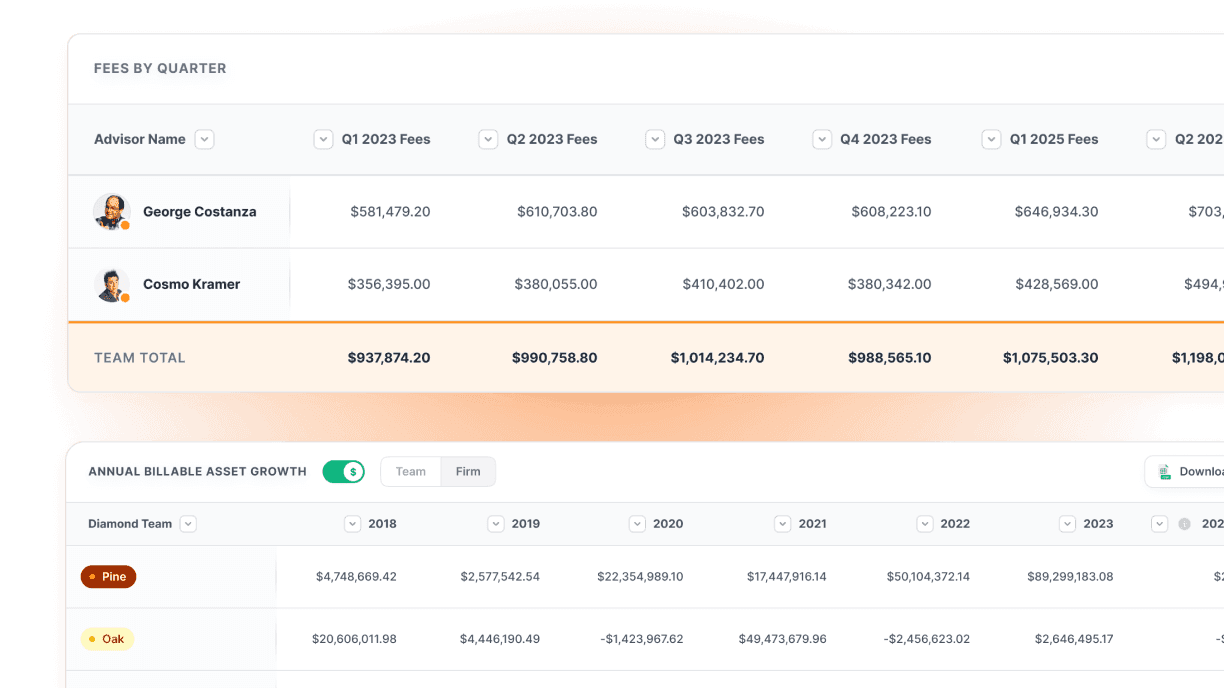
Unified Revenue Dashboard

Real-time revenue across all portfolio accounting systems
Multi-custodial data unified & reconciled automatically
Automated fee calculations with transparent methodologies
Any-angle analysis by advisor, office, client tier, product line

Orion, Black Diamond, Addepar data unified seamlessly
Cross-platform revenue validation & error detection
Performance fee calculations with complete transparency
Historical trending across all portfolio systems
Real-time revenue visibility for every advisor
Detailed breakdowns of fee calculations & sources
Historical performance & revenue trending
Self-service access to reduce revenue inquiries

Automated cross-validation across portfolio systems
Custodial data verification and error flagging
Billing platform synchronization and accuracy checks
Complete audit trail for every revenue calculation
Billing & Payout Automation
Connect any billing platform for automated reconciliation
Advisor payout calculations with complete transparency
Client billing accuracy with detailed fee breakdowns
Exception management for billing discrepancies


Month-End Reports

Click & Present
Advisor Questions
"Check Your Dashboard"
Revenue Accuracy
Exact Numbers, Every Time
Payout Disputes
Eliminated Through Transparency
REAL RESULTS
As firms grow, operations naturally get messy with disconnected systems. Milemarker’s™ seasoned team cuts through that chaos and simplifies the complex with nimble technology. They empower firms to focus on growth and client service instead of manual processes to cover technology gaps.

Lacey Shrum
Founder Smart Kx


Built For
Complex Revenue Structures


Multi-Portfolio System Support
Handle Orion, Black Diamond, Addepar, and any portfolio accounting system with unified reporting.


Advisor Compensation Integration
Connect revenue reporting directly to compensation calculations with complete transparency and accuracy.


Multi-Entity Revenue
Different fee structures across offices, brands, or business lines with unified oversight and reporting.


Client Billing Automation
Generate client-ready fee reports from unified portfolio and custodial data automatically.
Advanced
Revenue Features

Cross-System Validation
Automatic reconciliation between portfolio systems & custodians
Error detection & flagging for manual review
Data quality scoring & improvement recommendations
Historical accuracy tracking & trend analysis

Advisor Revenue Intelligence
Individual advisor dashboards with real-time revenue tracking
Fee calculation transparency & methodology explanations
Historical performance & growth trend analysis
Self-service portal reduces operational inquiries

Billing Platform Integration
Connect to any billing system for automated reconciliation
Invoice accuracy validation against portfolio data
Client billing transparency with detailed fee breakdowns
Automated payout calculations with advisor visibility

Exception Management
Automatic detection of revenue anomalies across systems
Portfolio accounting discrepancy identification & resolution
Custodial data validation & error correction workflows
Complete audit trail for every revenue adjustment

Why This Matters to Leadership
Every inaccurate revenue report costs you credibility. Every advisor question about their numbers costs you operational time.
As a leader, you need revenue intelligence that advisors trust.
Get Revenue Reporting That Creates Confidence.


Stop Reconciling Portfolio Systems Manually.

Stop Explaining Why Advisor Numbers Changed.